centos 7 elk安装与搭建_elk安装 centos
• wget https://artifacts.elastic.co/downloads/kibana/kibana-6.0.0-x86_64.rpm
• rpm -ivh kibana-6.0.0-x86_64.rpm
• kibana同样也需要安装x-pack(可省略)
• 安装方法同elasticsearch的x-pack
• cd /usr/share/kibana/bin (可省略)
• ./kibana-plugin install x-pack //如果这样安装比较慢,也可以下载zip文件(可省略)
• wget https://artifacts.elastic.co/downloads/packs/x-pack/x-pack-6.0.0.zip//这个文件和前面下载的那个其实是一个(可省略)
• ./kibana-plugin install file:///tmp/x-pack-6.0.0.zip (可省略)
•
• 以下在130上执行
• vim /etc/kibana/kibana.conf //增加
server.host: 0.0.0.0
elasticsearch.url: “http://192.168.133.130:9200”
logging.dest: /var/log/kibana.log
• touch /var/log/kibana.log; chmod 777 /var/log/kibana.log
• systemctl restart kibana
• 浏览器里访问http://192.168.133.130:5601/
• 用户名elastic,密码为之前你设置过的密码(如果未安装x-pack,不需要用户名密码)
• 若无法输入用户名密码,查日志/var/log/kibana.log
• 出现错误 Status changed from uninitialized to red - Elasticsearch is still initializing the kibana index.
• 解决办法:curl -XDELETE http://192.168.133.130:9200/.kibana -uelastic
ELK安装 – 安装logstash
• 以下在132上执行
• logstash目前不支持java9
• 直接yum安装(配置源同前面es的源)
• yum install -y logstash //如果慢,就下载rpm包
• wget https://artifacts.elastic.co/downloads/logstash/logstash-6.0.0.rpm
• cd /usr/share/logstash/bin/(可省略)
• ./logstash-plugin install file:///tmp/x-pack-6.0.0.zip (可省略)
• systemctl enable logstash
• systemctl start logstash
• logstash需要先安装java8,目前不支持java9
• 直接yum安装
• yum install -y logstash //如果慢,就下载rpm包
• wget https://artifacts.elastic.co/downloads/logstash/logstash-6.0.0.rpm
• rpm -ivh logstash-6.0.0.rpm
• logstash也需要安装x-pack(可省略)
• cd /usr/share/logstash/bin/ (可省略)
• ./logstash-plugin install file:///tmp/x-pack-6.0.0.zip (可省略)
logstash收集syslog日志
• 以下在132上操作
• 编辑配置文件 vi /etc/logstash/conf.d/syslog.conf//加入如下内容
input {
syslog {
type => "system-syslog"

port => 10514
}
}
output {
stdout {
codec => rubydebug
}
}
• 检测配置文件是否有错
• cd /usr/share/logstash/bin
• ./logstash –path.settings /etc/logstash/ -f /etc/logstash/conf.d/syslog.conf –config.test_and_exit
• 以下在132上操作
• 前台形式启动logstash
• ./logstash –path.settings /etc/logstash/ -f /etc/logstash/conf.d/syslog.conf//这样可以在屏幕上查看到日志输出,不能敲命令
• 再开一个终端
• 检测是否开启10514端口:netstat -lnp |grep 10514
• vi /etc/rsyslog.conf//在#### RULES下面增加一行
• . @@127.0.0.1:10514
• systemctl restart rsyslog
• 从130ssh到132上,可以在logstash前台的终端上看到ssh登录的相关日志
• 结束logstash,在前台的那个终端上按ctrl c
• 以下在132上操作
• 后台形式启动logstash
• 编辑配置文件 vi /etc/logstash/conf.d/syslog.conf//配置文件内容改为如下
input {
syslog {
type => "system-syslog"

port => 10514
}
}
output {
elasticsearch {
hosts => ["192.168.130.132:9200"]

index => "system-syslog-%{+YYYY.MM}"
}
}
• systemctl start logstash //启动需要一些时间,启动完成后,可以看到9600端口和10514端口已被监听
• 130上执行curl ‘localhost:9200/_cat/indices?v’ 可以获取索引信息
• curl -XGET ‘localhost:9200/indexname?pretty’ 可以获指定索引详细信息
• curl -XDELETE ‘localhost:9200/logstash-xxx-*’ 可以删除指定索引
• 浏览器访问192.168.132.130:5601,到kibana配置索引
• 左侧点击“Managerment”-> “Index Patterns”-> “Create Index Pattern”
• Index pattern这里需要根据前面curl查询到的索引名字来写,否则下面的按钮是无法点击的
logstash收集nginx日志
• 132上 编辑配置文件 vi /etc/logstash/conf.d/nginx.conf//加入如下内容
input {
file {
path => "/tmp/elk_access.log"

start_position => "beginning"

type => "nginx"
}
}
filter {
grok {

    match => { "message" => "%{IPORHOST:http_host} %{IPORHOST:clientip} - %{USERNAME:remote_user} \[%{HTTPDATE:timestamp}\] \"(?:%{WORD:http_verb} %{NOTSPACE:http_request}(?: HTTP/%{NUMBER:http_version})?|%{DATA:raw_http_request})\" %{NUMBER:response} (?:%{NUMBER:bytes_read}|-) %{QS:referrer} %{QS:agent} %{QS:xforwardedfor} %{NUMBER:request_time:float}"}

}

geoip {

    source => "clientip"

}
}
output {
stdout { codec => rubydebug }

elasticsearch {

    hosts => ["192.168.133.132:9200"]
index => “nginx-test-%{+YYYY.MM.dd}”
}
}
• 以下在132上操作
• 检测配置文件是否有错
• cd /usr/share/logstash/bin
• ./logstash –path.settings /etc/logstash/ -f /etc/logstash/conf.d/nginx.conf –config.test_and_exit
• yum install -y nginx
• vi /etc/nginx/conf.d/elk.conf//写入如下内容
server {
        listen 80;

        server_name elk.aming.com;


        location / {

            proxy_pass      http://192.168.133.130:5601;

            proxy_set_header Host   $host;

            proxy_set_header X-Real-IP      $remote_addr;

            proxy_set_header X-Forwarded-For $proxy_add_x_forwarded_for;

        }

        access_log  /tmp/elk_access.log main2;

    }
• 以下在132上操作
• vim /etc/nginx/nginx.conf//增加如下内容
log_format main2 ‘
httphost
h
t
t
p
h
o
s
t
http_host remote_addr -
remoteuser[
r
e
m
o
t
e
u
s
e
r
[
remote_user [time_local] “$request” ‘
                  '$status $body_bytes_sent "$http_referer" '

                  '"$http_user_agent" "$upstream_addr" $request_time';
• nginx -t
• systemctl start nginx
• 绑定hosts 192.168.133.132 elk.aming.com
• 浏览器访问,检查是否有日志产生
• systemctl restart logstash
• 130上curl ‘localhost:9200/_cat/indices?v’
• 检查是否有nginx-test开头的索引生成
• 如果有,才能到kibana里去配置该索引
• 左侧点击“Managerment”-> “Index Patterns”-> “Create Index Pattern”
• Index pattern这里写nginx-test-*
• 之后点击左侧的Discover
使用Beats采集日志
• https://www.elastic.co/cn/products/beats
• filebeat metricbeat packetbeat winlogbeat auditbeat heartbeat
• 可扩展,支持自定义构建
• 在133上执行
• wget https://artifacts.elastic.co/downloads/beats/filebeat/filebeat-6.0.0-x86_64.rpm
• rpm -ivh filebeat-6.0.0-x86_64.rpm
• 首先编辑配置文件
• vim /etc/filebeat/filebeat.yml //增加或者更改
filebeat.prospectors:
- type: log
paths:
+ /var/log/messages
output.console:
enable: true
• /usr/share/filebeat/bin/filebeat -c /etc/filebeat/filebeat.yml //可以在屏幕上看到对应的日志信息
• 再编辑配置文件
• vim /etc/filebeat/filebeat.yml //增加或者更改
filebeat.prospectors:
- input_type: log
paths:
+ /var/log/messages
output.elasticsearch:
hosts: [“192.168.133.130:9200”]
• systemctl start filebeat
扩展部分
• x-pack 收费,免费 http://www.jianshu.com/p/a49d93212eca
https://www.elastic.co/subscriptions
• Elastic stack演进 http://70data.net/1505.html
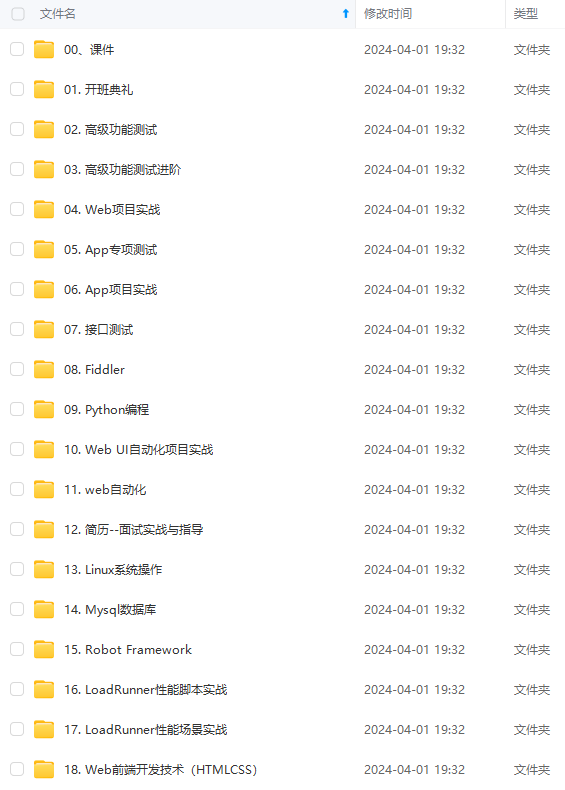
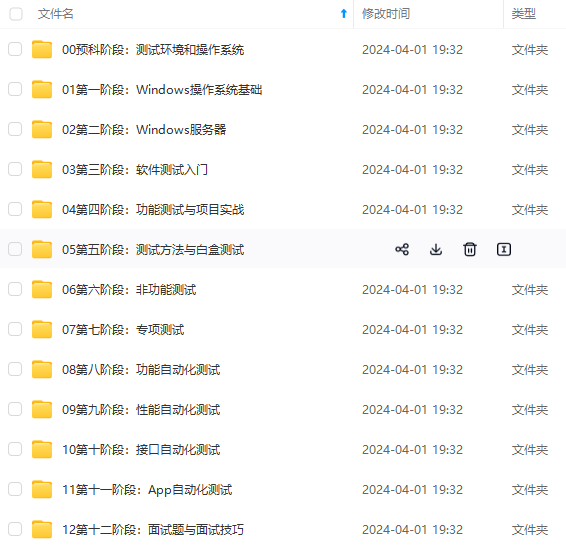
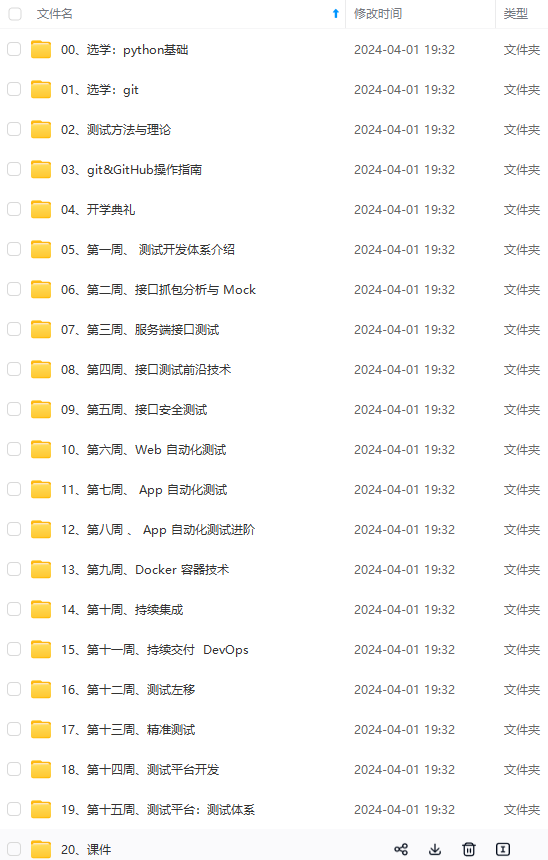
既有适合小白学习的零基础资料,也有适合3年以上经验的小伙伴深入学习提升的进阶课程,涵盖了95%以上软件测试知识点,真正体系化!
• vim /etc/filebeat/filebeat.yml //增加或者更改
filebeat.prospectors:
- input_type: log
paths:
+ /var/log/messages
output.elasticsearch:
hosts: [“192.168.133.130:9200”]
• systemctl start filebeat
扩展部分
• x-pack 收费,免费 http://www.jianshu.com/p/a49d93212eca
https://www.elastic.co/subscriptions
• Elastic stack演进 http://70data.net/1505.html
[外链图片转存中…(img-6hP7YSqV-1719210791377)]
[外链图片转存中…(img-TxIsWDak-1719210791378)]
[外链图片转存中…(img-hMhxuAEj-1719210791379)]
既有适合小白学习的零基础资料,也有适合3年以上经验的小伙伴深入学习提升的进阶课程,涵盖了95%以上软件测试知识点,真正体系化!

北京人形旗下天工造物具身智能开源社区,聚焦具身天工与慧思开物两大平台
更多推荐
 3
3 0
0- 0


 已为社区贡献1条内容

所有评论(0)