基于Prometheus监控的nginx负载均衡Web集群
目录
5.使用Prometheus对web集群的监控,结合Grafana进行数据展示
网络拓扑图

步骤
1.集群IP地址规划
test :192.168.127.132 测试服务器
web1 :192.168.127.129 nginx-web1服务器
web2 :192.168.127.130 nginx-web2服务器
nfs-server:192.168.127.135 nfs服务器
load-balancer1 :192.168.127.128 nginx负载均衡服务器(master)
load-balancer2 :192.168.127.133 nginx负载均衡服务器(backup)
prometheus :192.168.127.138 prometheus监控服务器
dns:192.168.127.131 dns服务器
2.创建NFS服务器为所有的web服务器提供相同Web数据
1.安装和启动nfs服务
[root@nfs-server ~]# yum install nfs-utils -y
[root@nfs-server ~]# service nfs-server start
Redirecting to /bin/systemctl start nfs-server.service
[root@nfs-server ~]#
2.编辑/etc/exports需要共享的目录,权限和网段。
[root@nfs-server /]# vim /etc/exports
[root@nfs-server /]# cat /etc/exports
/web 192.168.127.0/24(rw,all_squash,sync)
[root@nfs-server /]#
3.刷新输出文件目录
[root@nfs-server /]# exportfs -rv
exporting 192.168.127.0/24:/web
[root@nfs-server /]#
4.关闭防火墙和selinux
[root@nfs-server download]# service firewalld stop
Redirecting to /bin/systemctl stop firewalld.service
[root@nfs-server download]# systemctl disable firewalld
[root@nfs-server download]# getenforce
Disabled
[root@nfs-server download]#
5.在客户机上安装nfs服务并挂载nfs服务器共享的目录
[root@web1 lianxi]# yum install nfs-utils -y
[root@web1 lianxi]# mount 192.168.127.135:/web /usr/local/zhanghy99/html
[root@web1 lianxi]# cd /usr/local/scnginx/html
[root@web1 html]# ls
index.html
[root@web1 html]#
2.使用Nginx做负载均衡
1.以load-balancer1为例,编译nginx安装脚本,并运行脚本
[root@load-balancer1 ~]# vim onekey_install_nginx.sh

[root@load-balancer1 ~]# cat onekey_install_nginx.sh
#!/bin/bash

#解决软件的依赖关系,需要安装的软件包
yum install epel-release -y
yum -y install unzip zip zlib zlib-devel openssl openssl-devel pcre pcre-devel gcc gcc-c++ autoconf automake make psmisc net-tools lsof vim  wget -y

#新建zhanghaoyang用户和组
id  zhanghy || useradd zhanghy -s /sbin/nologin

#下载nginx软件
mkdir  /zhanghy99 -p
cd /zhanghy99
wget  https://nginx.org/download/nginx-1.21.4.tar.gz

#解压软件
tar xf nginx-1.21.4.tar.gz
#进入解压后的文件夹
cd nginx-1.21.4

#编译前的配置
./configure --prefix=/usr/local/zhanghy99  --user=zhanghy --group=zhanghy  --with-http_ssl_module   --with-threads  --with-http_v2_module  --with-http_stub_status_module  --with-stream
#如果上面的编译前的配置失败,直接退出脚本
if (( $? != 0));then
	exit
fi
#编译,启动2个进程去编译,这样速度快
make -j 2
#编译安装
make  install

#修改PATH变量
echo  "PATH=$PATH:/usr/local/zhanghy99/sbin" >>/root/.bashrc
#firewalld and selinux

#stop firewall和设置下次开机不启动firewalld
service firewalld stop
systemctl disable firewalld

#临时停止selinux和永久停止selinux
setenforce 0
sed  -i '/^SELINUX=/ s/enforcing/disabled/' /etc/selinux/config

#开机启动
chmod +x /etc/rc.d/rc.local
echo  "/usr/local/zhanghy99/sbin/nginx" >>/etc/rc.local

#修改nginx.conf的配置,例如:端口号,worker进程数,线程数,服务域名

sed  -i '/worker_processes/ s/1/2/' /usr/local/zhanghy99/conf/nginx.conf
sed  -i  '/worker_connections/ s/1024/2048/' /usr/local/zhanghy99/conf/nginx.conf

#启动nginx
/usr/local/zhanghy99/sbin/nginx


#  nginx  -s stop  停止服务
#  nginx   -s  reload  重启服务
#  nginx  启动服务
2.配置nginx的负载均衡
[root@load-balancer1 zhanghy99]# cd conf/
[root@load-balancer1 conf]# ls
fastcgi.conf          fastcgi_params.default  mime.types          nginx.conf.default   uwsgi_params
fastcgi.conf.default  koi-utf                 mime.types.default  scgi_params          uwsgi_params.default
fastcgi_params        koi-win                 nginx.conf          scgi_params.default  win-utf
[root@load-balancer1 conf]# vim nginx.conf
[root@load-balancer1 conf]# cat nginx.conf #以下仅显示修改了的脚本部分
http {
    include       mime.types;
    default_type  application/octet-stream;
    #log_format  main  '$remote_addr - $remote_user [$time_local] "$request" '
    #                  '$status $body_bytes_sent "$http_referer" '
    #                  '"$http_user_agent" "$http_x_forwarded_for"';
    #access_log  logs/access.log  main;
    sendfile        on;
    #tcp_nopush     on;
    #keepalive_timeout  0;
    keepalive_timeout  65;
    #gzip  on;
    upstream web_servers{ #定义一个负载均衡器的名字为:web_servers
        server 192.168.127.129:80;
        server 192.168.232.130:80;


}

    server {
        listen       80;
        server_name  www.sc.com; #设置域名为www.sc.com
        #charset koi8-r;
        #access_log  logs/host.access.log  main;
        location / {
        server 192.168.127.130:80;


}

    server {
        listen       80;
        server_name  www.sc.com; #设置域名为www.sc.com
        location /{
            proxy_pass http://web_servers; #调用负载均衡器

}

[root@load-balancer1 conf]# nginx -s reload # 重新加载配置文件

[root@load-banlancer1 conf]# ps aux|grep nginx

root        9301  0.0  1.2 120068  9824 ?        Ss   18:20   0:00 nginx: master process nginx

nginx       9395  0.1  1.0 152756  8724 ?        S    19:16   0:00 nginx: worker process

root        9397  0.0  0.1  12344  1044 pts/0    S+   19:18   0:00 grep --color=auto nginx

[root@load-balancer1 conf]#
3.搭建dns服务器
1.安装软件bind
[root@dns~]#
[root@dns ~]# yum install bind* -y
2.设置named服务开机启动,并且立马启动DNS服务
[root@dns~]# systemctl enable named
Created symlink from /etc/systemd/system/multi-user.target.wants/named.service to /usr/lib/systemd/system/named.service.
[root@dns ~]#
[root@dns ~]# systemctl start named  立马启动named进程
[root@dns~]# ps aux|grep named
named    14474  3.6  5.7 168300 57340 ?        Ssl  15:13   0:00 /usr/sbin/named -u named -c /etc/named.conf
root     14481  0.0  0.0 112824   980 pts/0    R+   15:13   0:00 grep --color=auto named
[root@dns~]#

[root@dns~]# netstat -anplut|grep named
tcp        0      0 127.0.0.1:53            0.0.0.0:*               LISTEN      14474/named
tcp        0      0 127.0.0.1:953           0.0.0.0:*               LISTEN      14474/named
tcp6       0      0 ::1:53                  :::*                    LISTEN      14474/named
tcp6       0      0 ::1:953                 :::*                    LISTEN      14474/named
udp        0      0 127.0.0.1:53            0.0.0.0:*                           14474/named
udp6       0      0 ::1:53                  :::*                                14474/named
[root@dns~]# vim /etc/resolv.conf
# Generated by NetworkManager
#nameserver 114.114.114.114
nameserver 127.0.0.1
3.修改配置文件,重启服务器允许其他电脑能过来查询dns域名
[root@dns~]# vim /etc/named.conf
options {
        listen-on port 53 { any; };  修改
        listen-on-v6 port 53 { any; }; 修改
        directory       "/var/named";
        dump-file       "/var/named/data/cache_dump.db";
        statistics-file "/var/named/data/named_stats.txt";
        memstatistics-file "/var/named/data/named_mem_stats.txt";
        recursing-file  "/var/named/data/named.recursing";
        secroots-file   "/var/named/data/named.secroots";
        allow-query     { any; }; 修改
[root@dns~]# service named restart 重启named服务
Redirecting to /bin/systemctl restart named.service
[root@dns~]#
[root@dns~]# netstat -anplut|grep named
tcp        0      0 192.168.0.180:53        0.0.0.0:*               LISTEN      16137/named
tcp        0      0 127.0.0.1:53            0.0.0.0:*               LISTEN      16137/named
tcp        0      0 127.0.0.1:953           0.0.0.0:*               LISTEN      16137/named
tcp6       0      0 :::53                   :::*                    LISTEN      16137/named
tcp6       0      0 ::1:953                 :::*                    LISTEN      16137/named
udp        0      0 192.168.0.180:53        0.0.0.0:*                           16137/named
udp        0      0 127.0.0.1:53            0.0.0.0:*                           16137/named
udp6       0      0 :::53                   :::*                                16137/named
[root@dns ~]#
4.修改配置文件,告诉named为sc.com提供域名解析
[root@dnsnamed]# vim /etc/named.rfc1912.zones

zone "sc.com" IN {
        type master;
        file "sc.com.zone";
        allow-update { none; };
};
5.添加上面的配置,建议在localhost的后面
[root@dns named]# cp -a  named.localhost sc.com.zone  复制产生一个sc.com的数据文件
[root@dns named]# ls
chroot  chroot_sdb  data  dynamic  dyndb-ldap  named.ca  named.empty  named.localhost  named.loopback  sc.com.zone  slaves
[root@dns named]#
[root@dns named]# ll
总用量 20
drwxr-x--- 7 root  named   61 12月  5 11:55 chroot
drwxr-x--- 7 root  named   61 12月  5 11:55 chroot_sdb
drwxrwx--- 2 named named   23 12月  5 11:57 data
drwxrwx--- 2 named named   60 12月  5 15:17 dynamic
drwxrwx--- 2 root  named    6 4月   1 2020 dyndb-ldap
-rw-r----- 1 root  named 2253 4月   5 2018 named.ca
-rw-r----- 1 root  named  152 12月 15 2009 named.empty
-rw-r----- 1 root  named  152 6月  21 2007 named.localhost
-rw-r----- 1 root  named  168 12月 15 2009 named.loopback
-rw-r----- 1 root  named  152 6月  21 2007 sc.com.zone
drwxrwx--- 2 named named    6 10月  4 15:06 slaves
[root@dns  named]#
[root@dns  named]# cat sc.com.zone
$TTL 1D
@	IN SOA	@ rname.invalid. (
					0	; serial
					1D	; refresh
					1H	; retry
					1W	; expire
					3H )	; minimum
	NS	@
	A	192.168.127.129
sc IN  A  192.168.127.129
sc IN  A  192.168.127.130
[root@dns named]#
刷新named服务
[root@dns  named]# service named restart
4.keepalived实现双VIP负载均衡高可用
dns负载均衡记录
www.sc.com 192.168.127.129
www.sc.com 192.168.127.130
1.安装keepalived软件,在2台负载均衡上都安装
[root@lb-1 conf]# yum install keepalived -y2.在每个机器上启用2个vrrp实例
[root@lb-1 keepalived]# pwd
/etc/keepalived
[root@lb-1 keepalived]# ls
keepalived.conf
[root@lb-1 keepalived]# vim keepalived.conf
[root@lb-1 keepalived]# cat keepalived.conf
! Configuration File for keepalived

global_defs {
   notification_email {
     acassen@firewall.loc
     failover@firewall.loc
     sysadmin@firewall.loc
   }
   notification_email_from Alexandre.Cassen@firewall.loc
   smtp_server 192.168.200.1
   smtp_connect_timeout 30
   router_id LVS_DEVEL
   vrrp_skip_check_adv_addr
   #vrrp_strict
   vrrp_garp_interval 0
   vrrp_gna_interval 0
}

vrrp_instance VI_1 {
    state MASTER
    interface ens33
    virtual_router_id 28
    priority 120
    advert_int 1
    authentication {
        auth_type PASS
        auth_pass 1111
    }
    virtual_ipaddress {
        192.168.127.119
    }
}
vrrp_instance VI_2 {
    state BACKUP
    interface ens33
    virtual_router_id 29
    priority 100
    advert_int 1
    authentication {
        auth_type PASS
        auth_pass 1111
    }
    virtual_ipaddress {
        192.168.127.120
    }
}
[root@lb-1 keepalived]#
第2台机器上的配置
[root@lb2 keepalived]# cat keepalived.conf
! Configuration File for keepalived

global_defs {
   notification_email {
     acassen@firewall.loc
     failover@firewall.loc
     sysadmin@firewall.loc
   }
   notification_email_from Alexandre.Cassen@firewall.loc
   smtp_server 192.168.200.1
   smtp_connect_timeout 30
   router_id LVS_DEVEL
   vrrp_skip_check_adv_addr
   #vrrp_strict
   vrrp_garp_interval 0
   vrrp_gna_interval 0
}

vrrp_instance VI_1 {
    state BACKUP
    interface ens33
    virtual_router_id 28
    priority 100
    advert_int 1
    authentication {
        auth_type PASS
        auth_pass 1111
    }
    virtual_ipaddress {
        192.168.127.119
    }
}
vrrp_instance VI_2 {
    state MASTER
    interface ens33
    virtual_router_id 29
    priority 120
    advert_int 1
    authentication {
        auth_type PASS
        auth_pass 1111
    }
    virtual_ipaddress {
        192.168.127.120
    }
}


[root@lb2 keepalived]# 5.使用Prometheus对web集群的监控,结合Grafana进行数据展示
1.安装prometheus server
https://github.com/prometheus/prometheus/releases/download/v2.41.0/prometheus-2.41.0.linux-amd64.tar.gz
源码安装
1.上传下载的源码包到linux服务器
[root@sc-prom ~]# mkdir /prom
[root@sc-prom ~]# cd /prom
[root@sc-prom prom]# ls
prometheus-2.34.0.linux-amd64.tar.gz
[root@sc-prom prom]#
2.解压源码包
[root@sc-prom prom]# tar xf prometheus-2.34.0.linux-amd64.tar.gz
[root@sc-prom prom]# ls
prometheus-2.34.0.linux-amd64  prometheus-2.34.0.linux-amd64.tar.gz
[root@sc-prom prom]#
修改解压后的压缩包名字
[root@sc-prom prom]# mv prometheus-2.34.0.linux-amd64 prometheus
[root@sc-prom prom]# ls
prometheus  prometheus-2.34.0.linux-amd64.tar.gz
[root@sc-prom prom]#
临时和永久修改PATH变量,添加prometheus的路径
[root@sc-prom prometheus]# PATH=/prom/prometheus:$PATH
[root@sc-prom prometheus]# cat /root/.bashrc
# .bashrc

# User specific aliases and functions

alias rm='rm -i'
alias cp='cp -i'
alias mv='mv -i'

# Source global definitions
if [ -f /etc/bashrc ]; then
	. /etc/bashrc
fi
PATH=/prom/prometheus:$PATH   #添加
执行prometheus程序
[root@prometheus prometheus]# nohup prometheus  --config.file=/prom/prometheus/prometheus.yml &
[1] 8431
[root@prometheus prometheus]# nohup: 忽略输入并把输出追加到"nohup.out"

[root@prometheus prometheus]#
2.把prometheus做成一个服务来进行管理
查看prometheus的进程
[root@prometheus prometheus]# ps aux|grep prome
root       8431  4.5  2.4 782084 46204 pts/0    Sl   11:21   0:00 prometheus --config.file=/prom/prometheus/prometheus.yml
root       8439  0.0  0.0 112824   980 pts/0    S+   11:21   0:00 grep --color=auto prome
[root@prometheus prometheus]#

查看prometheus监听的端口号
[root@prometheus prometheus]# netstat -anplut|grep prome
tcp6       0      0 :::9090                 :::*                    LISTEN      8431/prometheus
tcp6       0      0 ::1:9090                ::1:51738               ESTABLISHED 8431/prometheus
tcp6       0      0 ::1:51738               ::1:9090                ESTABLISHED 8431/prometheus
[root@prometheus prometheus]#
关闭服务器上的firewalld服务
[root@prometheus prometheus]# service firewalld stop
Redirecting to /bin/systemctl stop firewalld.service
[root@prometheus prometheus]# systemctl disable firewalld
Removed symlink /etc/systemd/system/multi-user.target.wants/firewalld.service.
Removed symlink /etc/systemd/system/dbus-org.fedoraproject.FirewallD1.service.
[root@prometheus prometheus]#


[root@prometheus prometheus]# vim /usr/lib/systemd/system/prometheus.service
[Unit]
Description=prometheus
[Service]
ExecStart=/prom/prometheus/prometheus --config.file=/prom/prometheus/prometheus.yml
ExecReload=/bin/kill -HUP $MAINPID
KillMode=process
Restart=on-failure
[Install]
WantedBy=multi-user.target

[root@prometheus prometheus]# systemctl daemon-reload 重新加载systemd相关的服务

[root@prometheus prometheus]#
第一次因为是使用nohup 方式启动的prometheus,还是需要使用后kill 的方式杀死第一次启动的进程
后面可以使用service方式管理prometheus了
[root@prometheus prometheus]#  service prometheus stop
Redirecting to /bin/systemctl stop prometheus.service
[root@prometheus prometheus]# ps aux|grep prome
root       8431  0.2  3.2 782340 61472 pts/0    Sl   11:21   0:01 prometheus --config.file=/prom/prometheus/prometheus.yml
root       8650  0.0  0.0 112824   980 pts/0    S+   11:35   0:00 grep --color=auto prome
[root@prometheus prometheus]# kill -9 8431
[root@prometheus prometheus]# ps aux|grep prome
root       8652  0.0  0.0 112824   976 pts/0    R+   11:35   0:00 grep --color=auto prome
[1]+  已杀死               nohup prometheus --config.file=/prom/prometheus/prometheus.yml
[root@prometheus prometheus]#


[root@prometheus prometheus]#  service prometheus start
Redirecting to /bin/systemctl start prometheus.service
[root@prometheus prometheus]# ps aux|grep prome
root       8671 14.0  2.4 782084 45764 ?        Ssl  11:35   0:00 /prom/prometheus/prometheus --config.file=/prom/prometheus/prometheus.yml
root       8679  0.0  0.0 112824   980 pts/0    S+   11:35   0:00 grep --color=auto prome
[root@prometheus prometheus]#  service prometheus stop
Redirecting to /bin/systemctl stop prometheus.service

[root@prometheus prometheus]#
[root@prometheus prometheus]# ps aux|grep prome
root       8698  0.0  0.0 112824   976 pts/0    S+   11:35   0:00 grep --color=auto prome
[root@prometheus prometheus]#
3.在node节点服务器上安装exporter程序
1.下载node_exporter-1.4.0-rc.0.linux-amd64.tar.gz源码,上传到节点服务器上
2.解压
[root@web1 ~]# ls
anaconda-ks.cfg  name_ip.txt                                  sanchuang1290
feng.txt         node_exporter-1.4.0-rc.0.linux-amd64.tar.gz  sanchuang1965
input.sh         onekey_install_changjinghu.sh                sanchuang{random.randint(1,10000)}
liang            sanchuang
[root@web1 ~]# tar xf node_exporter-1.4.0-rc.0.linux-amd64.tar.gz
[root@web1 ~]# ls
anaconda-ks.cfg  name_ip.txt                                  sanchuang
feng.txt         node_exporter-1.4.0-rc.0.linux-amd64         sanchuang1290
input.sh         node_exporter-1.4.0-rc.0.linux-amd64.tar.gz  sanchuang1965
liang            onekey_install_changjinghu.sh                sanchuang{random.randint(1,10000)}
单独存放到/node_exporter文件夹
[root@web1 ~]# mv node_exporter-1.4.0-rc.0.linux-amd64 /node_exporter
[root@web1 ~]#
[root@web1 ~]# cd /node_exporter/
[root@web1 node_exporter]# ls
LICENSE  node_exporter  NOTICE
[root@web1 node_exporter]#
修改PATH变量
[root@web1 node_exporter]# PATH=/node_exporter/:$PATH
[root@web1 node_exporter]# vim /root/.bashrc
PATH=/node_exporter/:$PATH #添加
执行node exporter 代理程序agent
[root@web1 node_exporter]#nohup node_exporter --web.listen-address 0.0.0.0:8090  &

具体的端口号,可以自己定义,只要不和其他的服务冲突就可以

[root@web1 node_exporter]# ps aux|grep node
root      24958  0.6  0.6 716288  6476 pts/0    Sl+  11:45   0:00 node_exporter --web.listen-address 0.0.0.0:8090
root      24981  0.0  0.0 112824   988 pts/1    R+   11:46   0:00 grep --color=auto node
[root@web1 node_exporter]# netstat -anplult|grep 8090
tcp6       0      0 :::8090                 :::*                    LISTEN      24958/node_exporter
[root@web1 node_exporter]#

访问node节点上的metrics
http://192.168.127.129:8090/metrics
4.在prometheus server里添加我们在哪些机器里安装了exporter程序
[root@sc-prom prometheus]# vim prometheus.yml

scrape_configs:
  # The job name is added as a label `job=<job_name>` to any timeseries scraped from this config.
  - job_name: "prometheus"
    static_configs:
      - targets: ["localhost:9090"]
      #添加下面的配置采集node-liangrui服务器的metrics
  - job_name: "prom"
    static_configs:
      - targets: ["192.168.127.138:8090"]
  - job_name: "LB1"
    static_configs:
      - targets: ["192.168.127.128:8090"]
  - job_name: "LB2"
    static_configs:
      - targets: ["192.168.127.133:8090"]
  - job_name: "nfs"
    static_configs:
      - targets: ["192.168.127.135:8090"]
  - job_name: "web1"
    static_configs:
      - targets: ["192.168.127.129:8090"]
  - job_name: "web2"
    static_configs:
      - targets: ["192.168.127.130:8090"]
5.安装部署grafana
wget https://dl.grafana.com/enterprise/release/grafana-enterprise-9.1.2-1.x86_64.rpm
安装
[root@sc-prom grafana]# ls
grafana-enterprise-8.4.5-1.x86_64.rpm
[root@sc-prom grafana]# yum install grafana-enterprise-8.4.5-1.x86_64.rpm -y
启动grafana
[root@sc-prom grafana]# service grafana-server start
Starting grafana-server (via systemctl):                   [  确定  ]
[root@sc-prom grafana]#
监听的端口号是3000
[root@sc-prom grafana]# netstat -anplut|grep grafana
tcp        0      0 192.168.127.138:52062     34.120.177.193:443      ESTABLISHED 5413/grafana-server
tcp6       0      0 :::3000                 :::*                    LISTEN      5413/grafana-server
[root@sc-prom grafana]#
登录,在浏览器里登录
http://192.168.127.138:3000/
默认的用户名和密码是
用户名admin
密码admin
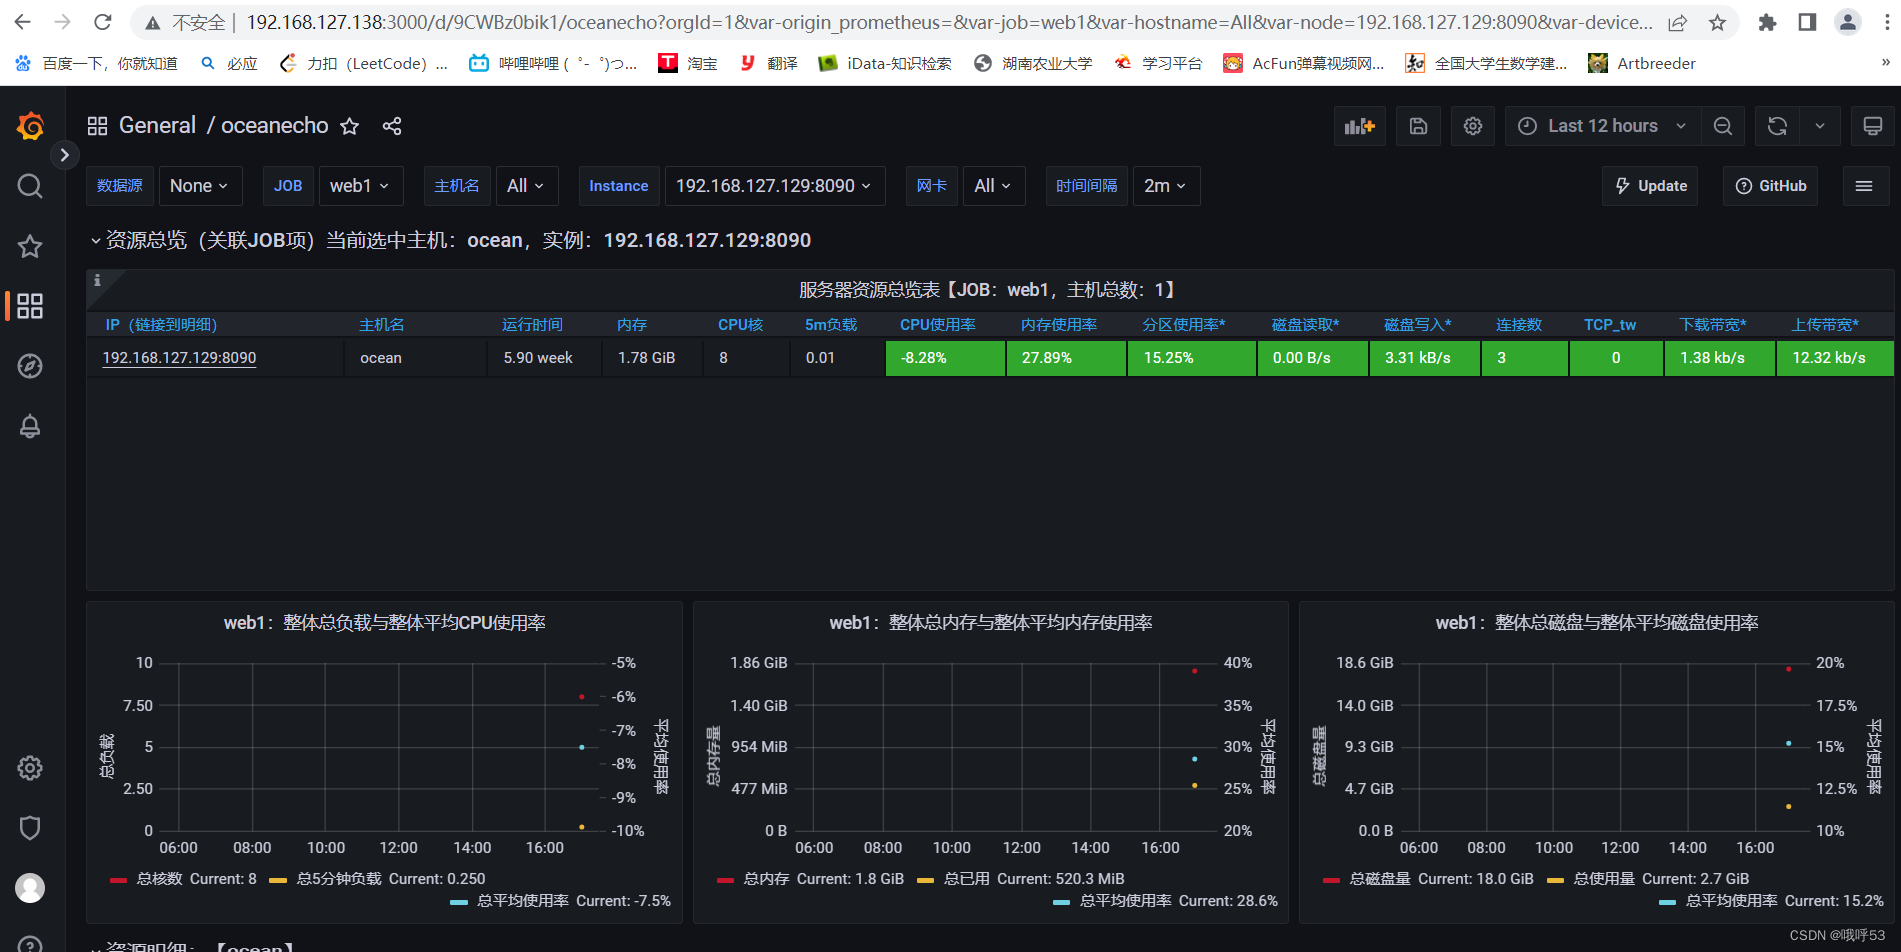
6.grafanaUI页面展示

北京人形旗下天工造物具身智能开源社区,聚焦具身天工与慧思开物两大平台
更多推荐
 0
0 0
0- 0


 已为社区贡献1条内容

所有评论(0)