ZrLog 高可用架构监控部署指南(Prometheus + Grafana)
ZrLog 高可用架构监控部署指南(Prometheus + Grafana)
部署日期: 2026-03-18
适配系统:RHEL9.3
一、整体架构
| 角色 | IP | 部署内容 |
|---|---|---|
| 监控服务器 | 172.25.254.30 | Prometheus + Grafana |
| 数据库服务器 | 172.25.254.99 | MariaDB |
| 应用服务器 1 | 172.25.254.100 | ZrLog(Maven 构建 Jar)+ JDK11 |
| 应用服务器 2 | 172.25.254.200 | ZrLog(Maven 构建 Jar)+ JDK11 |
| HAProxy Master1 | 172.25.254.10 | HAProxy + Keepalived + 邮件 |
| HAProxy Master2 | 172.25.254.20 | HAProxy + Keepalived + 邮件 |
| VIP1 | 172.25.254.101 | Keepalived 虚拟 IP |
| VIP2 | 172.25.254.102 | Keepalived 虚拟 IP |
前置准备(所有服务器)
# 1. 关闭防火墙(永久关闭,生产环境可按需放行端口)
systemctl stop firewalld && systemctl disable firewalld
# 2. 关闭SELinux(永久关闭,需重启生效;临时关闭:setenforce 0)
sed -i 's/^SELINUX=.*/SELINUX=disabled/' /etc/selinux/config
setenforce 0
# 3. 安装基础依赖
dnf install -y wget net-tools tar grep
# 4. 检查关键端口是否占用(9090/3000/9100)
netstat -tulpn | grep -E "9090|3000|9100"
# 若有占用,先停止对应进程(例:kill -9 进程ID)
二、部署过程
2.1 安装 Prometheus(192.168.223.25)
# 1. 下载 Prometheus 包(确认架构匹配,ARM 需替换为arm64包)
cd /root
wget https://github.com/prometheus/prometheus/releases/download/v2.51.2/prometheus-2.51.2.linux-amd64.tar.gz
# 校验包完整性(可选,需提前下载校验文件)
# wget https://github.com/prometheus/prometheus/releases/download/v2.51.2/sha256sums.txt
# sha256sum -c sha256sums.txt --ignore-missing
# 2. 解压
tar -xzf prometheus-2.51.2.linux-amd64.tar.gz
# 3. 创建配置目录并赋权
mkdir -p /root/prometheus/data
chmod 755 /root/prometheus -R
# 4. 配置 Prometheus(严格保证YAML缩进/语法)
cat > /root/prometheus/prometheus.yml << 'EOF'
global:
scrape_interval: 15s
evaluation_interval: 15s
scrape_configs:
- job_name: 'prometheus'
static_configs:
- targets: ['localhost:9090']
- job_name: '172.25.254.10'
static_configs:
- targets: ['172.25.254.10:9100']
labels:
instance: 'HAProxy1'
- job_name: '172.25.254.100'
static_configs:
- targets: ['172.25.254.100:9100']
labels:
instance: 'ZrLog1'
- job_name: '172.25.254.99'
static_configs:
- targets: ['172.25.254.99:9104']
labels:
instance: 'MariaDB'
# ===================== 补齐 MySQL 指标采集 =====================
- job_name: 'mysql-172.25.254.99'
static_configs:
- targets: ['172.25.254.99:9104']
labels:
instance: 'MariaDB-MySQL'
- job_name: '172.25.254.20'
static_configs:
- targets: ['172.25.254.20:9100']
labels:
instance: 'HAProxy2'
- job_name: '172.25.254.200'
static_configs:
- targets: ['172.25.254.200:9100']
labels:
instance: 'ZrLog2'
EOF
# 5. 验证配置文件语法
/root/prometheus-2.51.2.linux-amd64/promtool check config /root/prometheus/prometheus.yml
# 6. 启动 Prometheus(后台运行,绑定所有网卡)
cd /root/prometheus-2.51.2.linux-amd64
nohup ./prometheus \
--config.file=/root/prometheus/prometheus.yml \
--storage.tsdb.path=/root/prometheus/data \
--web.enable-admin-api \
--web.enable-lifecycle \
--web.listen-address=0.0.0.0:9090 > /root/prometheus.log 2>&1 &
# 7. 验证启动状态
sleep 5
ps -ef | grep prometheus | grep -v grep
# 检查端口监听
netstat -tulpn | grep 9090
# 查看日志(无报错则正常)
tail -10 /root/prometheus.log重启 Prometheus 生效
pkill prometheus
cd /root/prometheus-2.51.2.linux-amd64
nohup ./prometheus \
--config.file=/root/prometheus/prometheus.yml \
--storage.tsdb.path=/root/prometheus/data \
--web.enable-admin-api \
--web.enable-lifecycle \
--web.listen-address=0.0.0.0:9090 > /root/prometheus.log 2>&1 &2.2 安装 Grafana(192.168.223.25)
# 1. 添加 Grafana 官方源(解决包不存在问题)
cat > /etc/yum.repos.d/grafana.repo << 'EOF'
[grafana]
name=grafana
baseurl=https://mirrors.tuna.tsinghua.edu.cn/grafana/yum/rpm/
enabled=1
gpgcheck=0
EOF
# 2. 安装 Grafana 及依赖
dnf install -y grafana
# 3. 启动并设置开机自启
systemctl start grafana-server
systemctl enable grafana-server
# 4. 验证启动状态
systemctl status grafana-server
# 检查端口监听
netstat -tulpn | grep 3000
# 查看 Grafana 日志(排查启动故障)
journalctl -u grafana-server -f2.3 安装 node_exporter(所有被监控节点)
单节点手动部署(每台目标机器执行)
# 1. 下载 node_exporter 包(监控服务器可先下载后scp,目标节点也可直接下载)
cd /root
wget https://github.com/prometheus/node_exporter/releases/download/v1.8.0/node_exporter-1.8.0.linux-amd64.tar.gz
# 2. 解压
tar -xzf node_exporter-1.8.0.linux-amd64.tar.gz
# 3. 启动 node_exporter(后台运行,绑定所有网卡)
nohup ./node_exporter-1.8.0.linux-amd64/node_exporter \
--web.listen-address=0.0.0.0:9100 > /root/node_exporter.log 2>&1 &
# 4. 验证启动状态
sleep 3
ps -ef | grep node_exporter | grep -v grep
netstat -tulpn | grep 9100
tail -5 /root/node_exporter.log安装 mysqld_exporter(仅数据库服务器 192.168.223.22)
专门采集 MySQL/MariaDB 性能指标,供 Prometheus 拉取、Grafana 展示。
# 1. 解压安装包
cd /root
tar -xzf mysqld_exporter-0.15.1.linux-amd64.tar.gz
# 2. 创建认证配置文件(存放MySQL账号)
cat > /root/.my.cnf << 'EOF'
[client]
user=zrlog
password=zrlog123456
host=localhost
EOF
# 3. 后台启动 mysqld_exporter(默认端口9104)
nohup ./mysqld_exporter-0.15.1.linux-amd64/mysqld_exporter \
--config.my-cnf="/root/.my.cnf" \
--web.listen-address=0.0.0.0:9104 > /root/mysqld_exporter.log 2>&1 &
# 4. 验证启动
ps -ef | grep mysqld_exporter | grep -v grep
netstat -tulpn | grep 9104三、Web 页面配置
3.1 访问地址
| 服务 | 地址 | 默认账号 | 注意事项 |
|---|---|---|---|
| Prometheus | http://172.25.254.30:9090 | 无需登录 | 确保服务器防火墙 / SELinux 已关闭 |
| Grafana | http://172.25.254.30:3000 | admin / admin | 首次登录强制修改密码 |
3.2 Grafana 配置步骤
步骤 1:登录 Grafana
-
浏览器访问 http://172.25.254.30:3000
-
输入默认账号:
admin,密码:admin -
按提示修改新密码(建议记录)
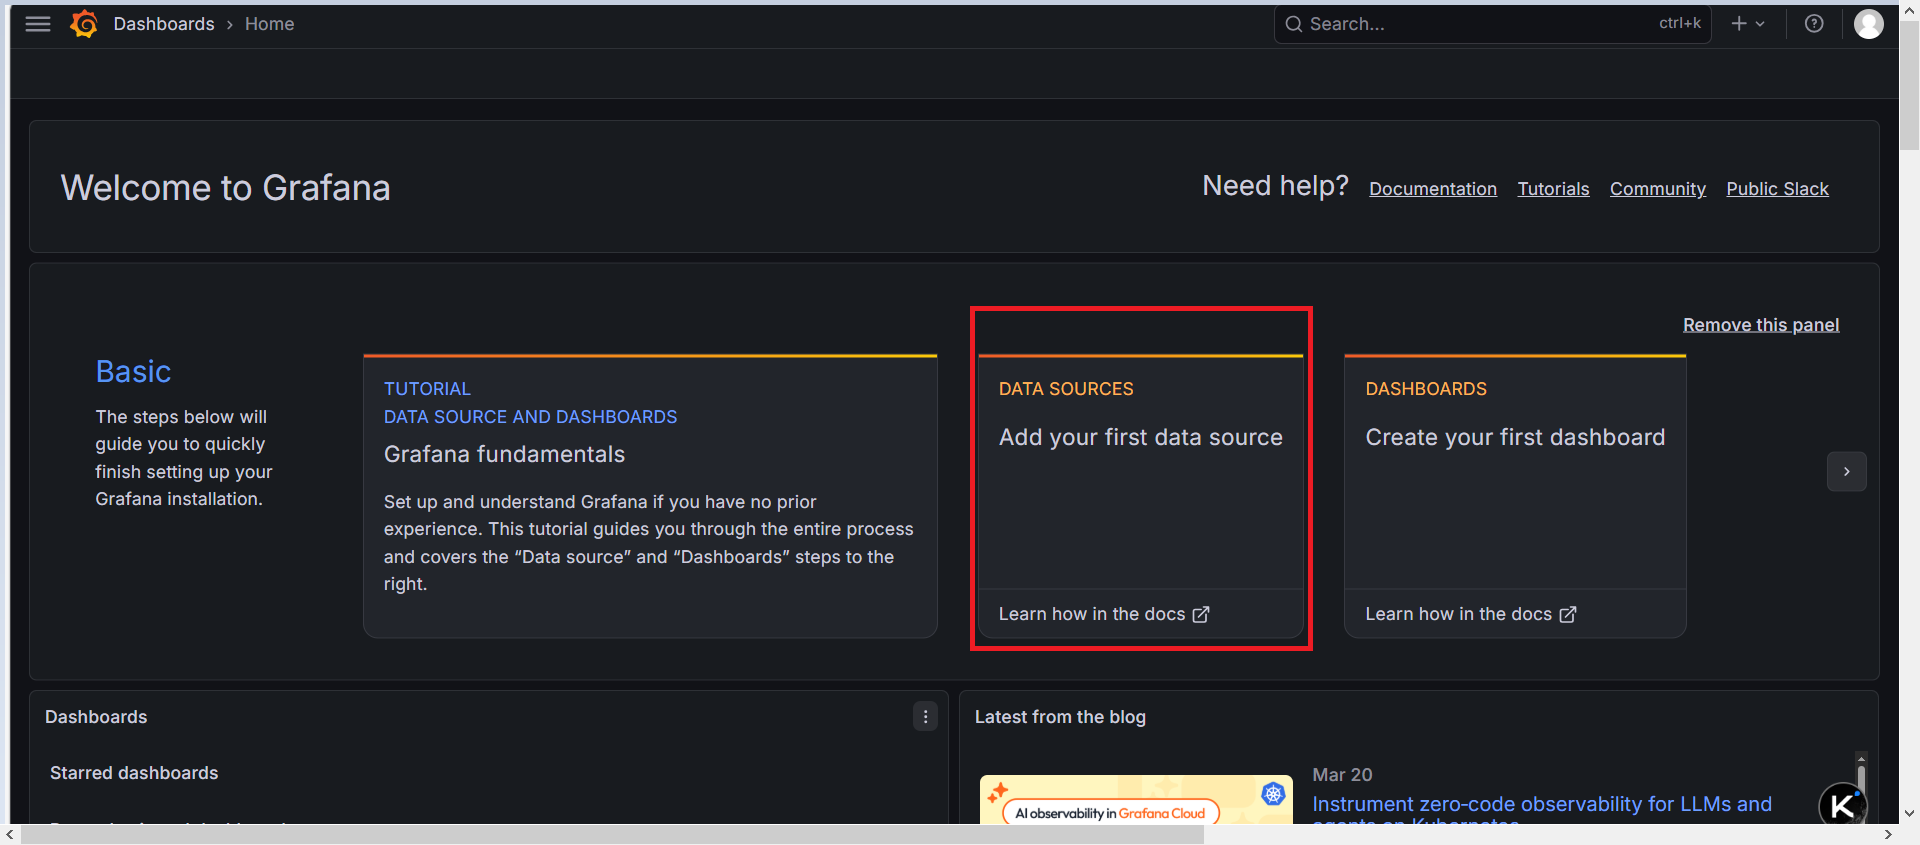
步骤 2:添加 Prometheus 数据源
-
左侧菜单 → Configuration → Data Sources
-
点击 Add data source,选择 Prometheus
-
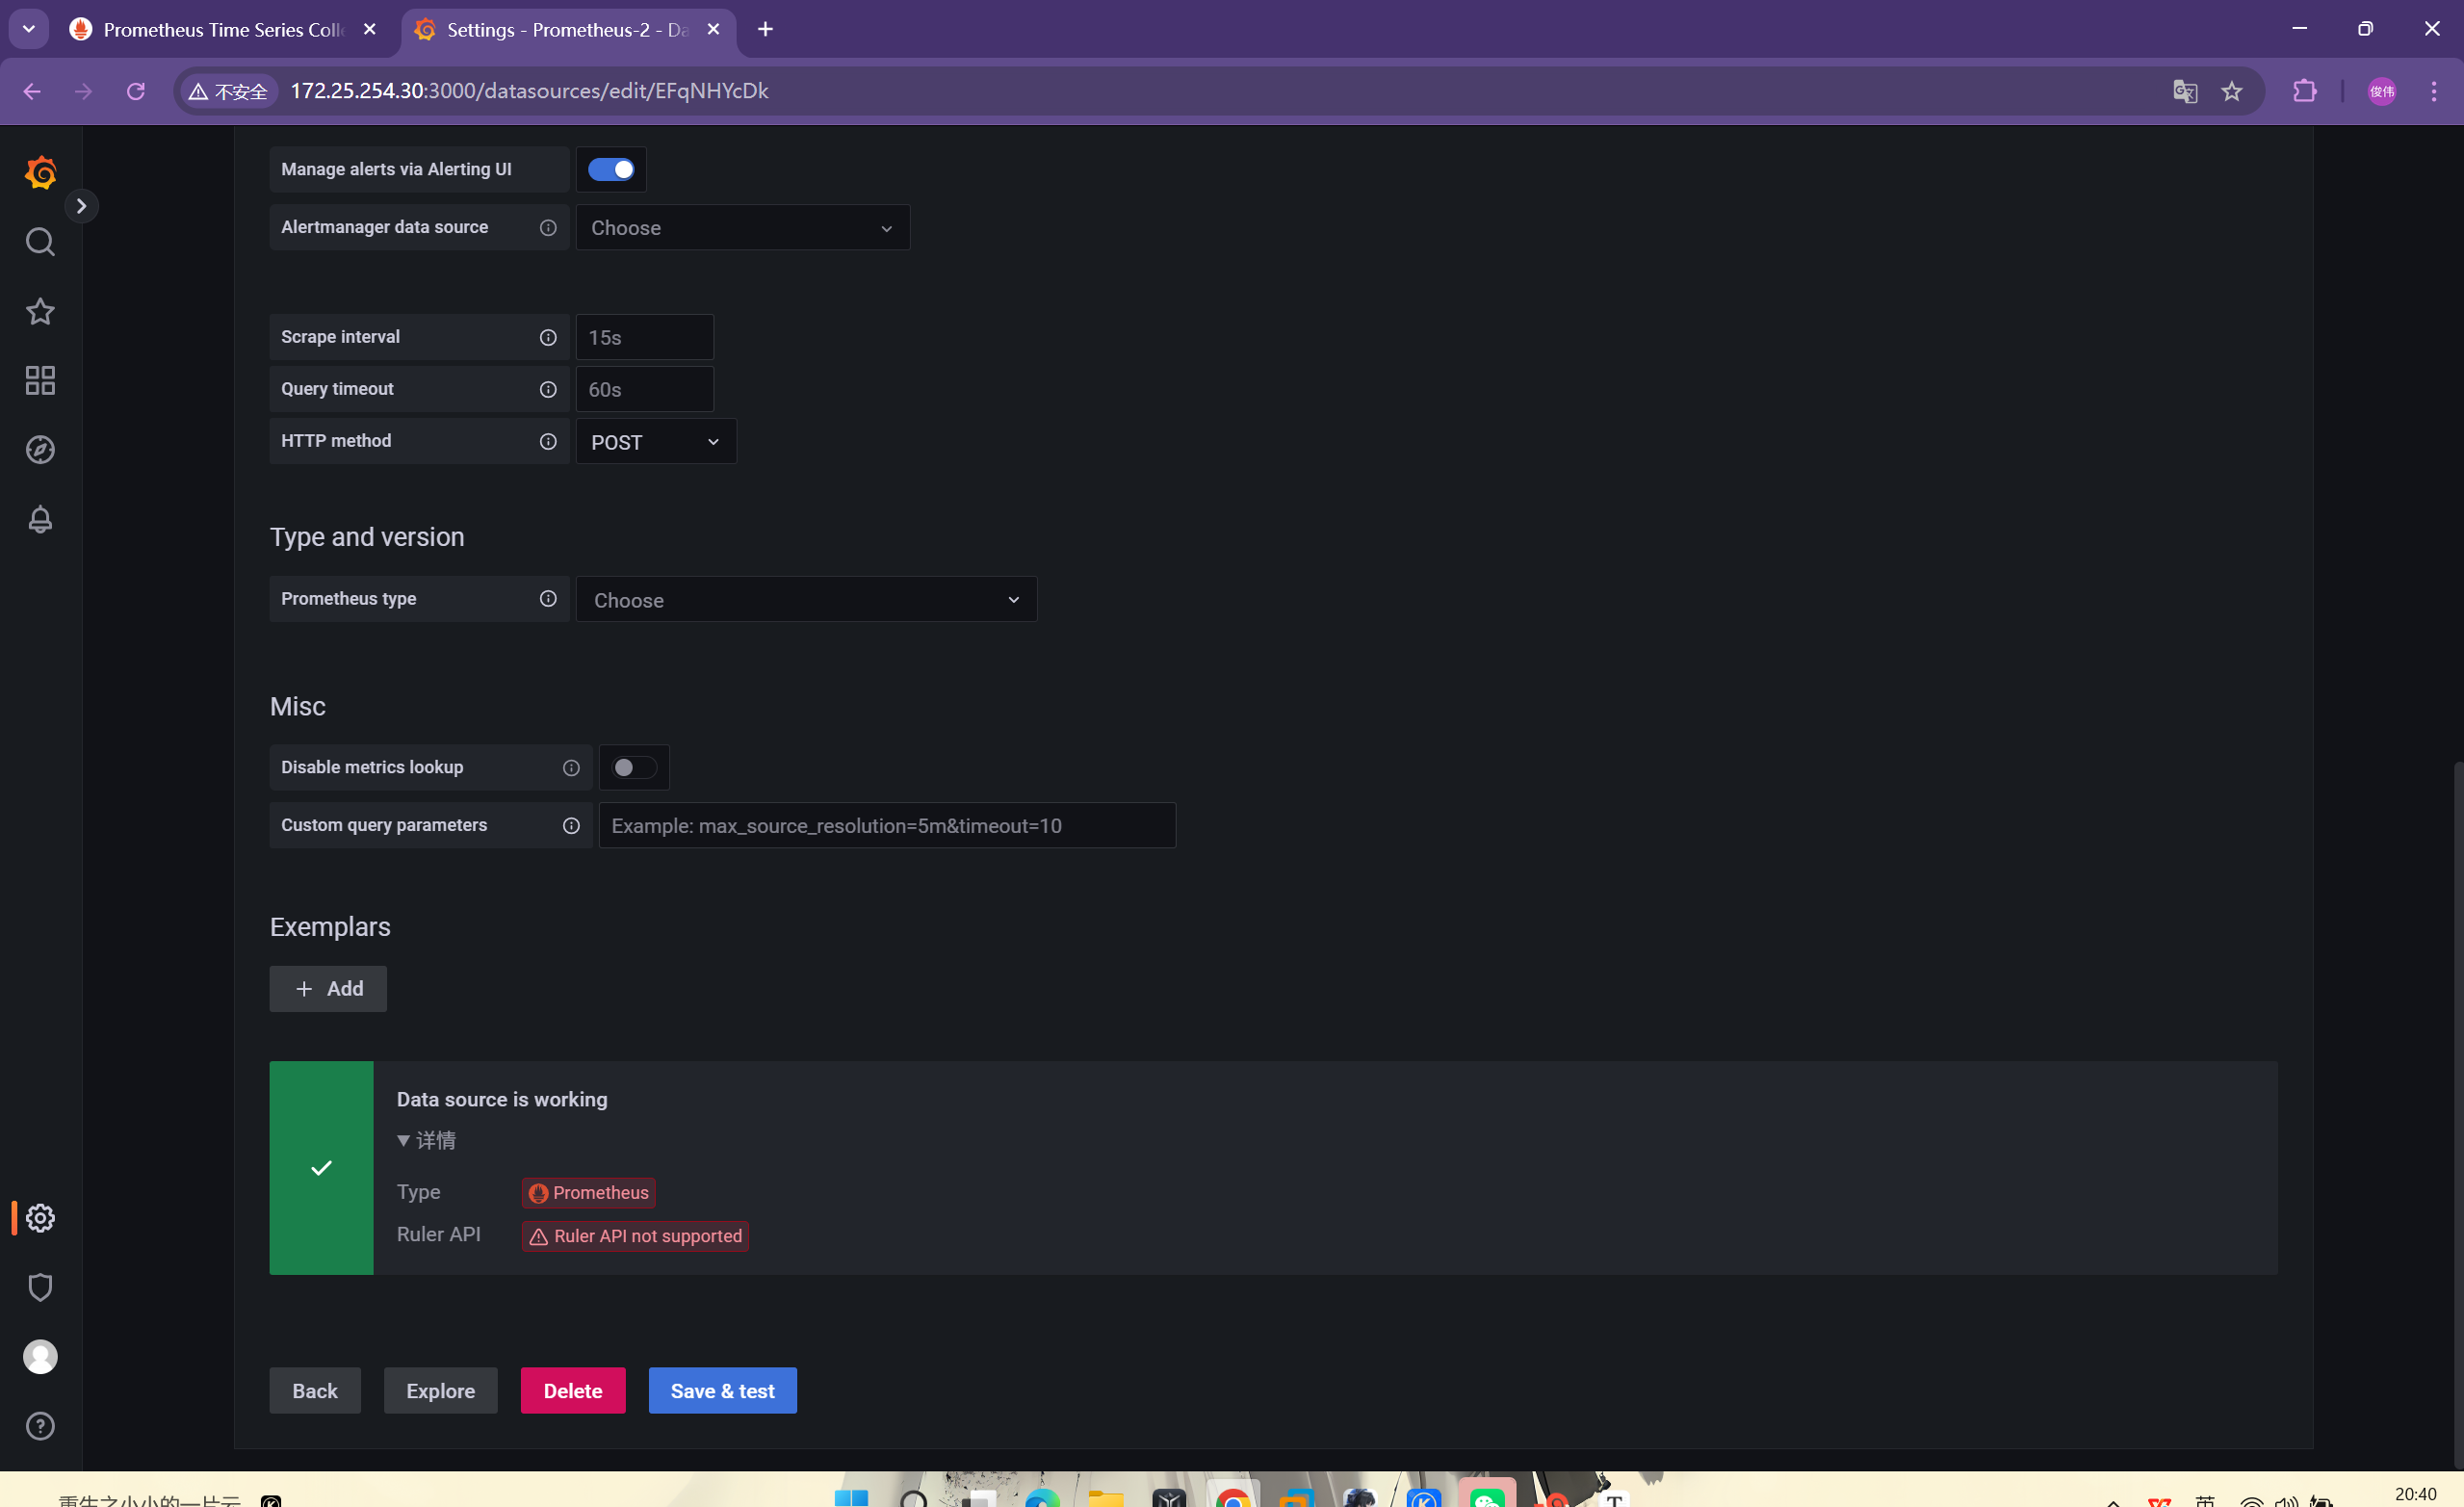
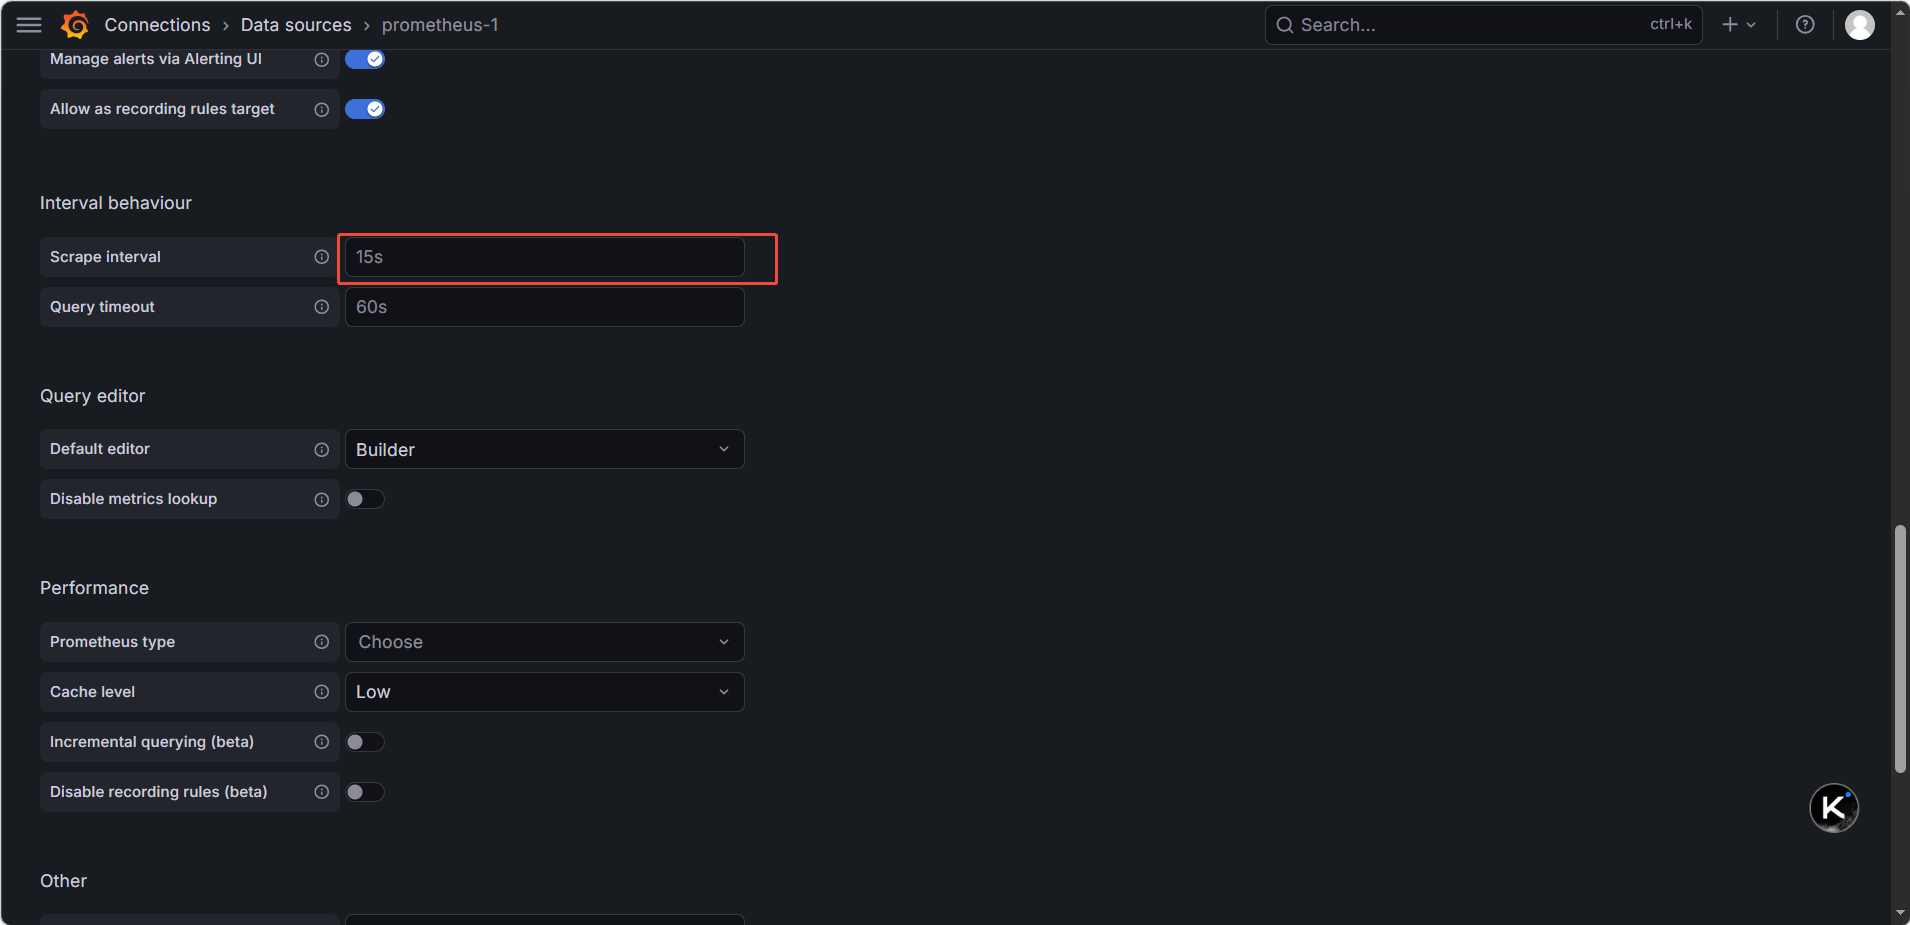
核心配置:
-
URL: http://172.25.254.30:9090(必须填写监控服务器 IP,避免localhost)
-
Scrape Interval: 15s(与 Prometheus 配置一致)
-
-
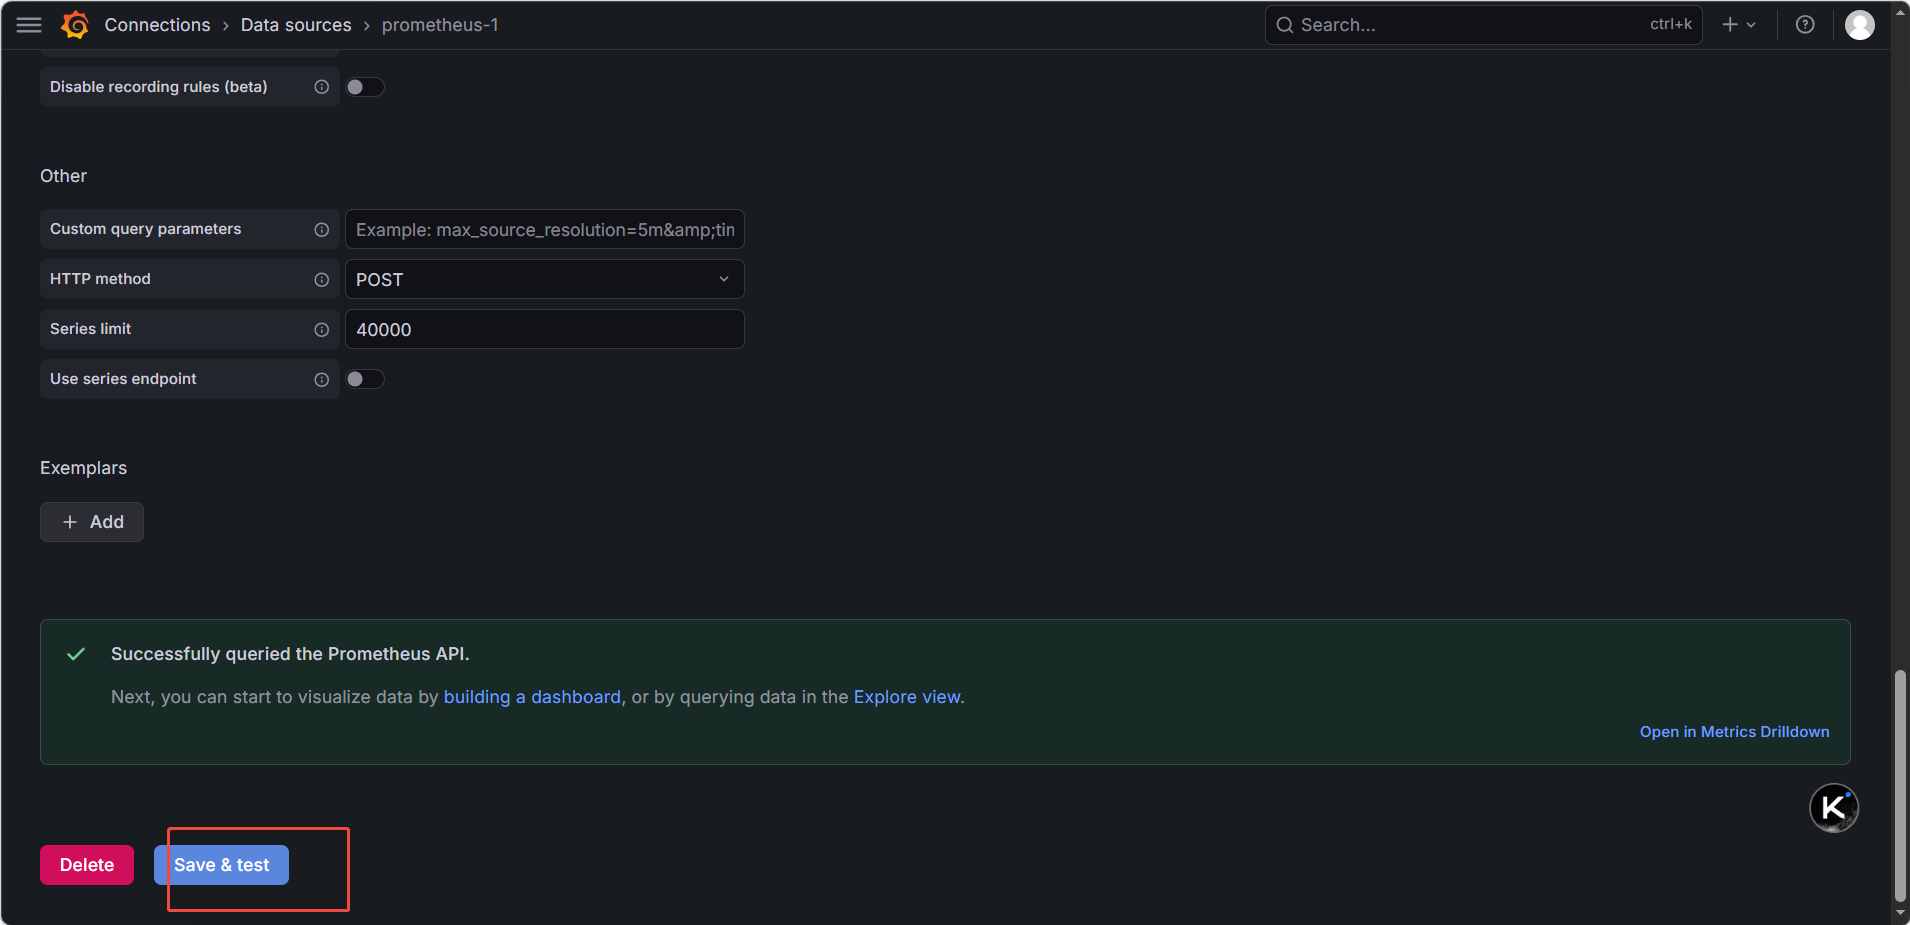
点击 Save & Test
✅ 提示
Data source is working表示成功;❌ 失败排查:检查 Prometheus 是否启动、9090 端口是否监听、网络是否互通。
步骤 3:导入监控面板
方式 1:在线导入(服务器需联网)
-
左侧菜单 → Dashboards → Import
-
输入推荐面板 ID,点击
Load:
-
1860- Node Exporter Full(系统全维度监控,推荐) -
15869- Prometheus Blackbox Exporter(网络探测) -
10856- HAProxy Metrics(HAProxy 专属监控)
-
-
选择已添加的 Prometheus 数据源,点击 Import。
方式 2:离线导入(服务器无外网)
-
本地浏览器访问 Grafana Dashboards,搜索对应 ID 下载 JSON 文件;
-
Grafana 页面点击 Upload JSON file,选择下载的文件,关联数据源后导入。
方式 3:手动创建面板(示例)
标准监控大盘布局
| 位置 | 面板标题 | PromQL | 可视化类型 |
|---|---|---|---|
| 左上 | 服务器 CPU 使用率 | 100 - (avg by (instance) (rate(node_cpu_seconds_total{mode="idle"}[1m])) * 100) | Time series |
| 右上 | 服务器内存使用率 | 100 - (node_memory_MemAvailable_bytes / node_memory_MemTotal_bytes * 100) | Time series |
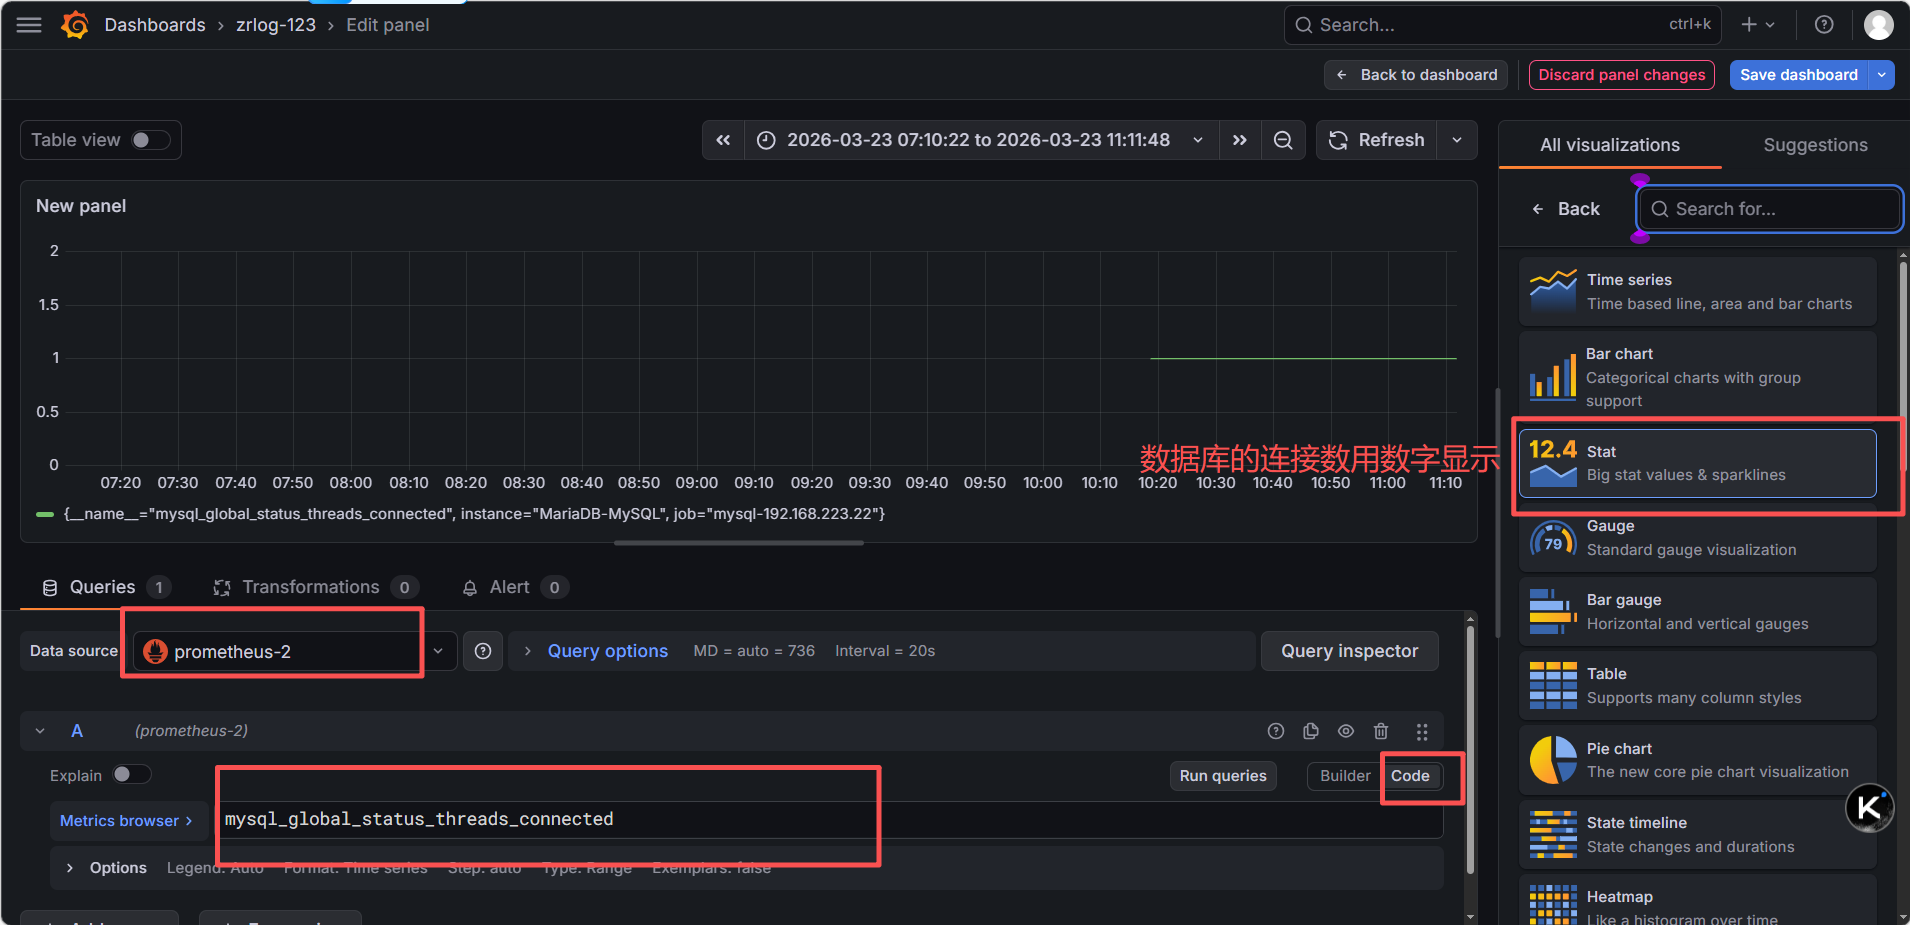
| 左下 | MySQL 当前连接数 | mysql_global_status_threads_connected | Stat(大数字) |
| 右下 | MySQL QPS | irate(mysql_global_status_queries[5m]) | Time series |
操作步骤:
-
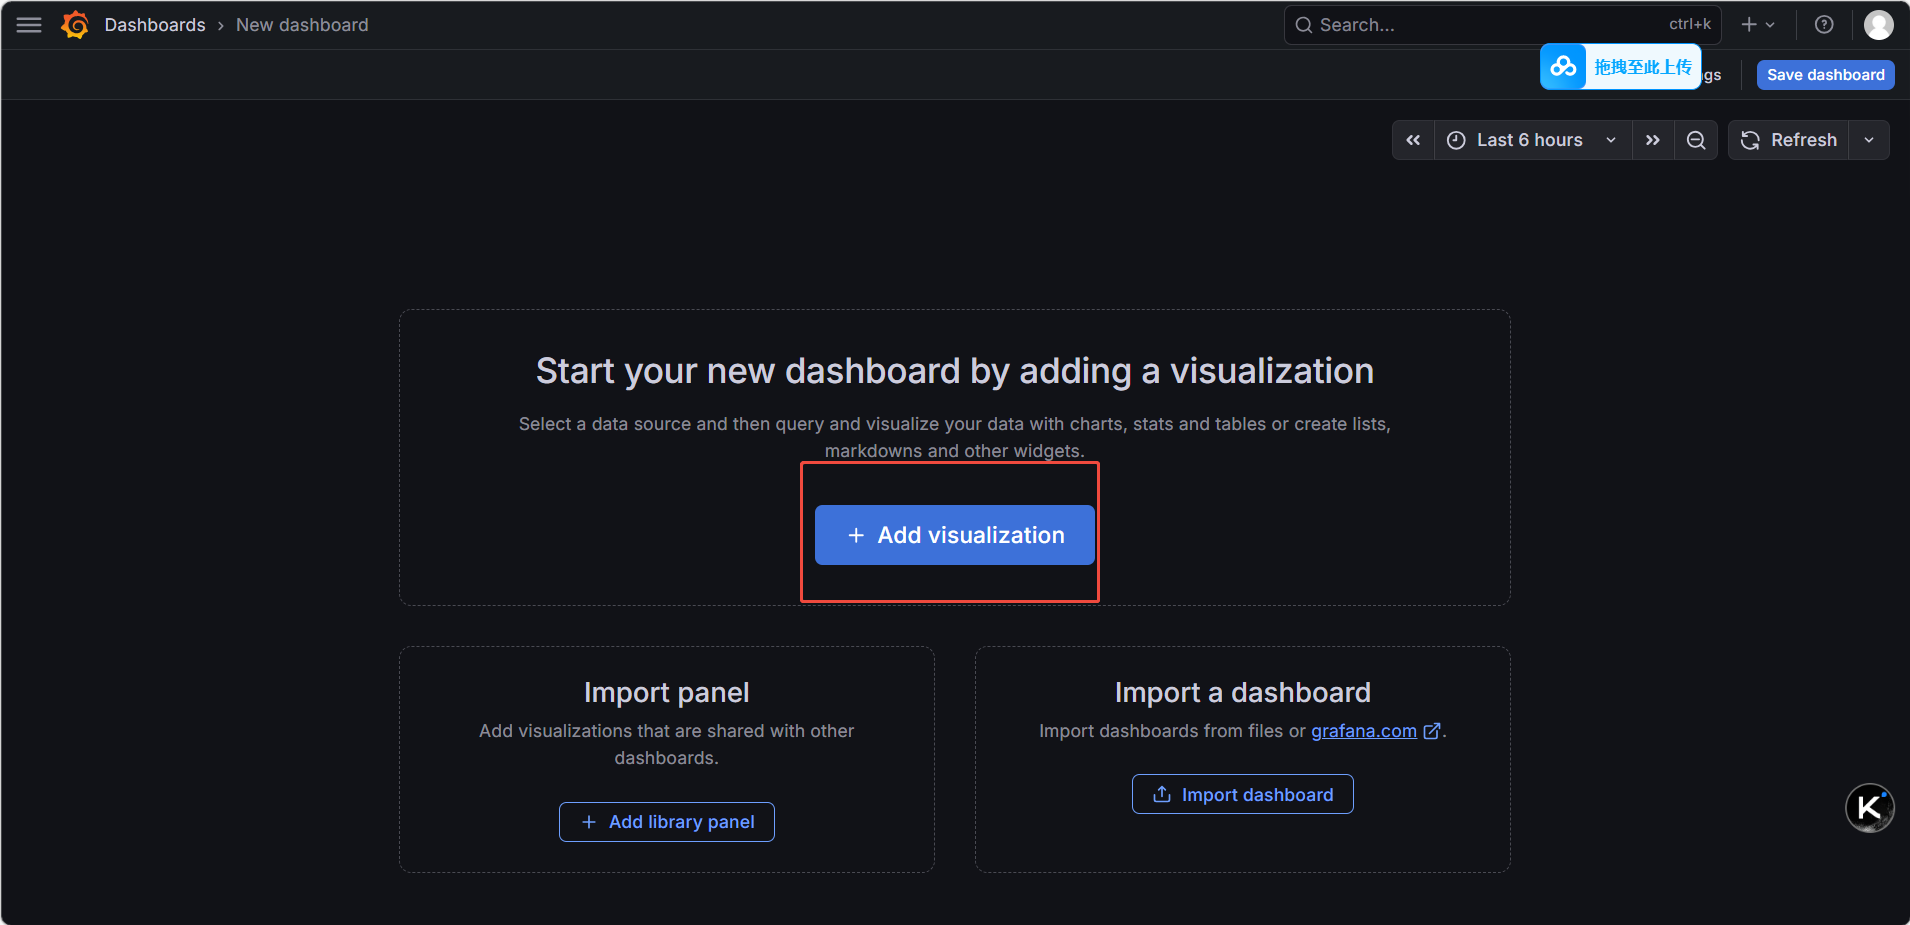
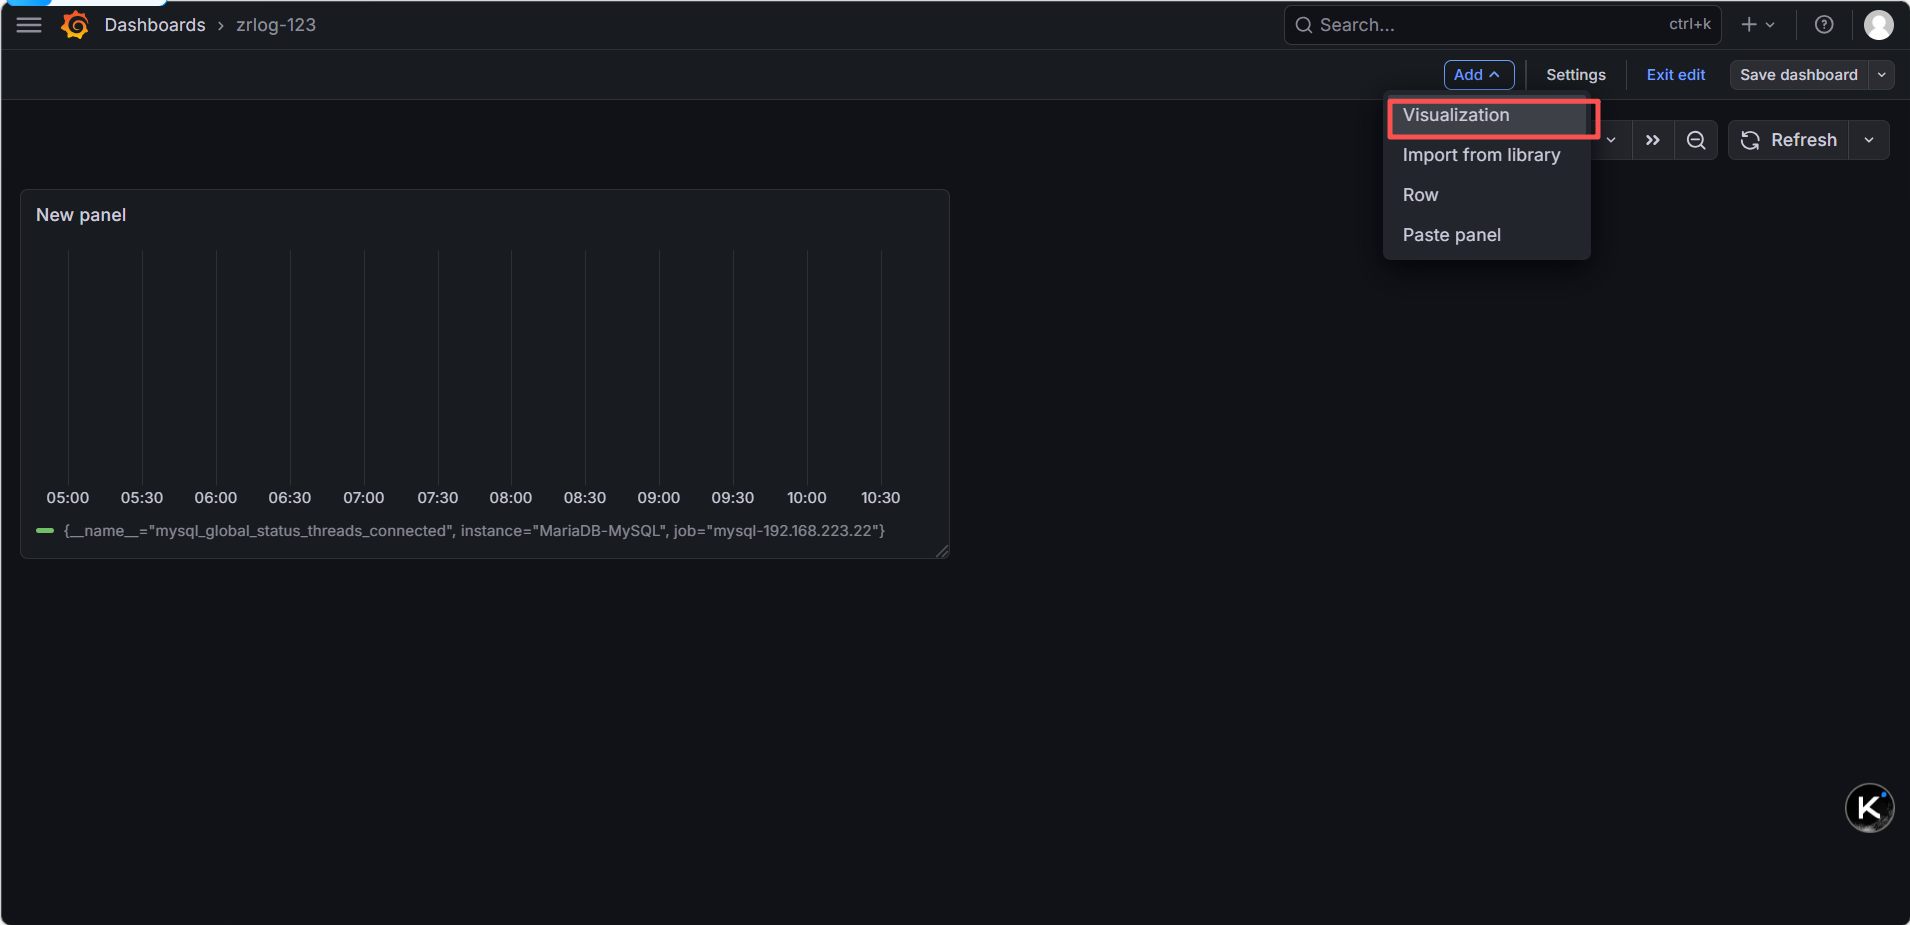
左侧菜单 → Dashboards → New Dashboard
-
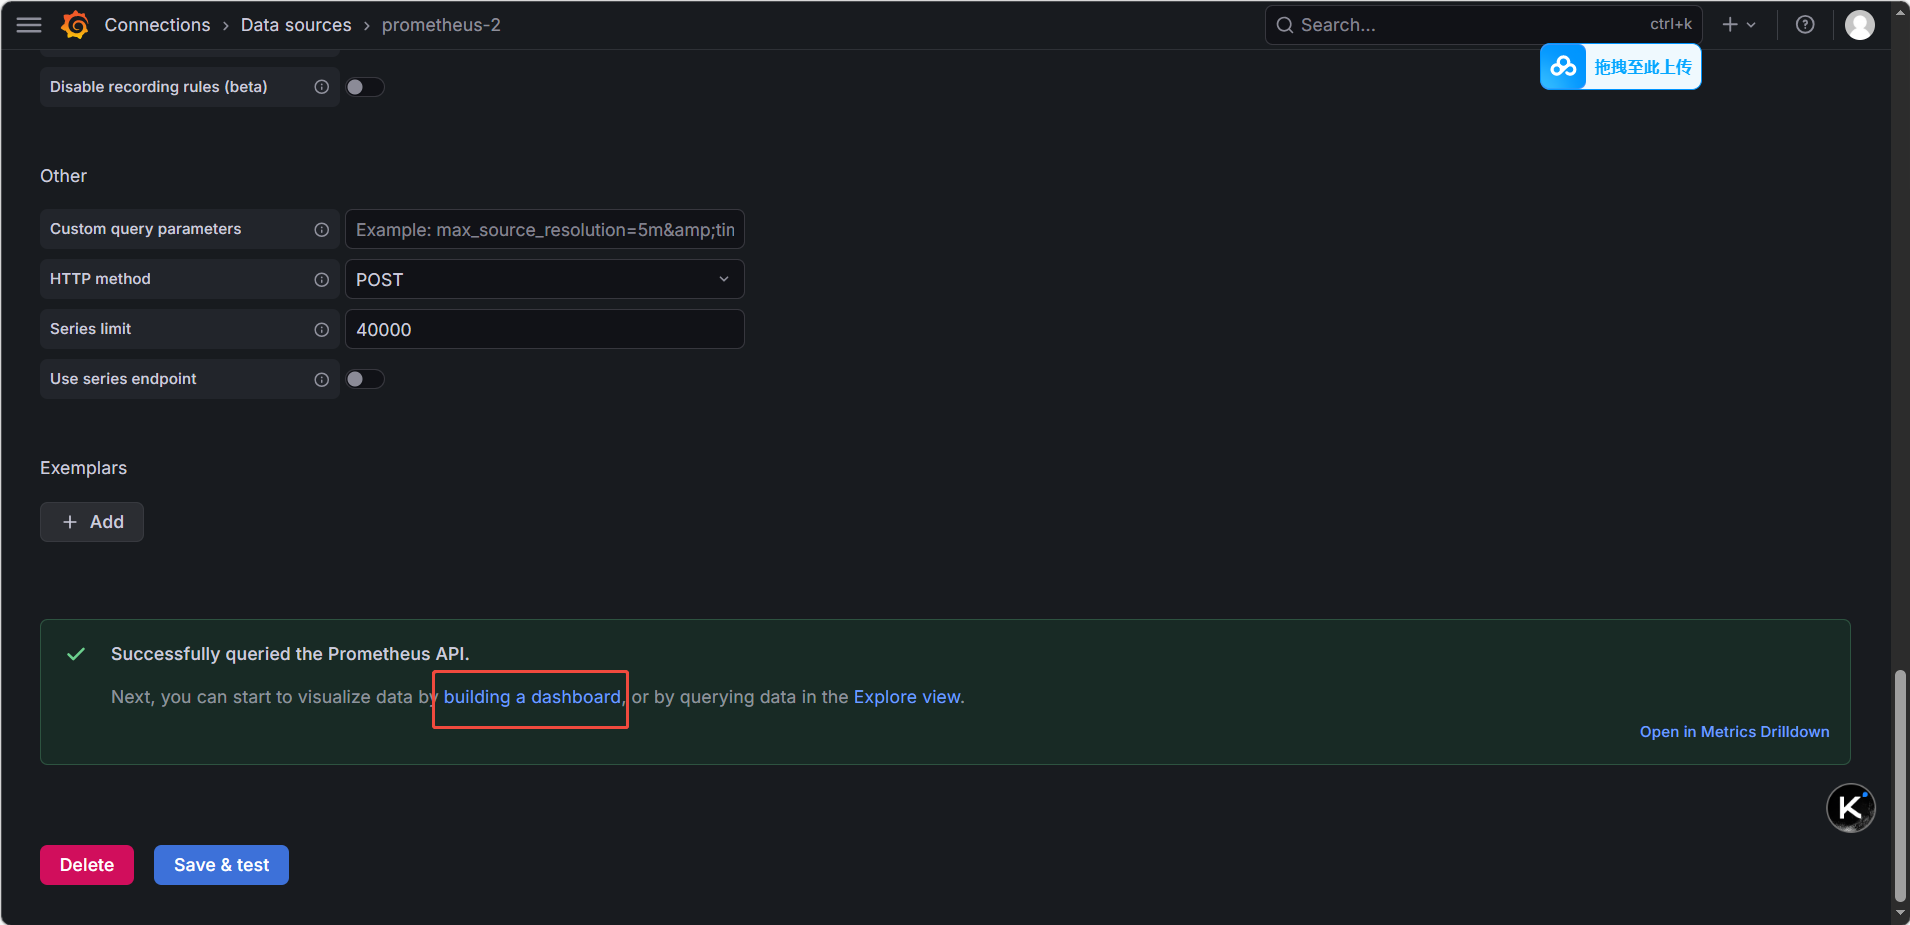
点击 Add → Visualization,选择 Prometheus
-
在查询框输入对应 PromQL 语句,点击 Apply 生成图表。
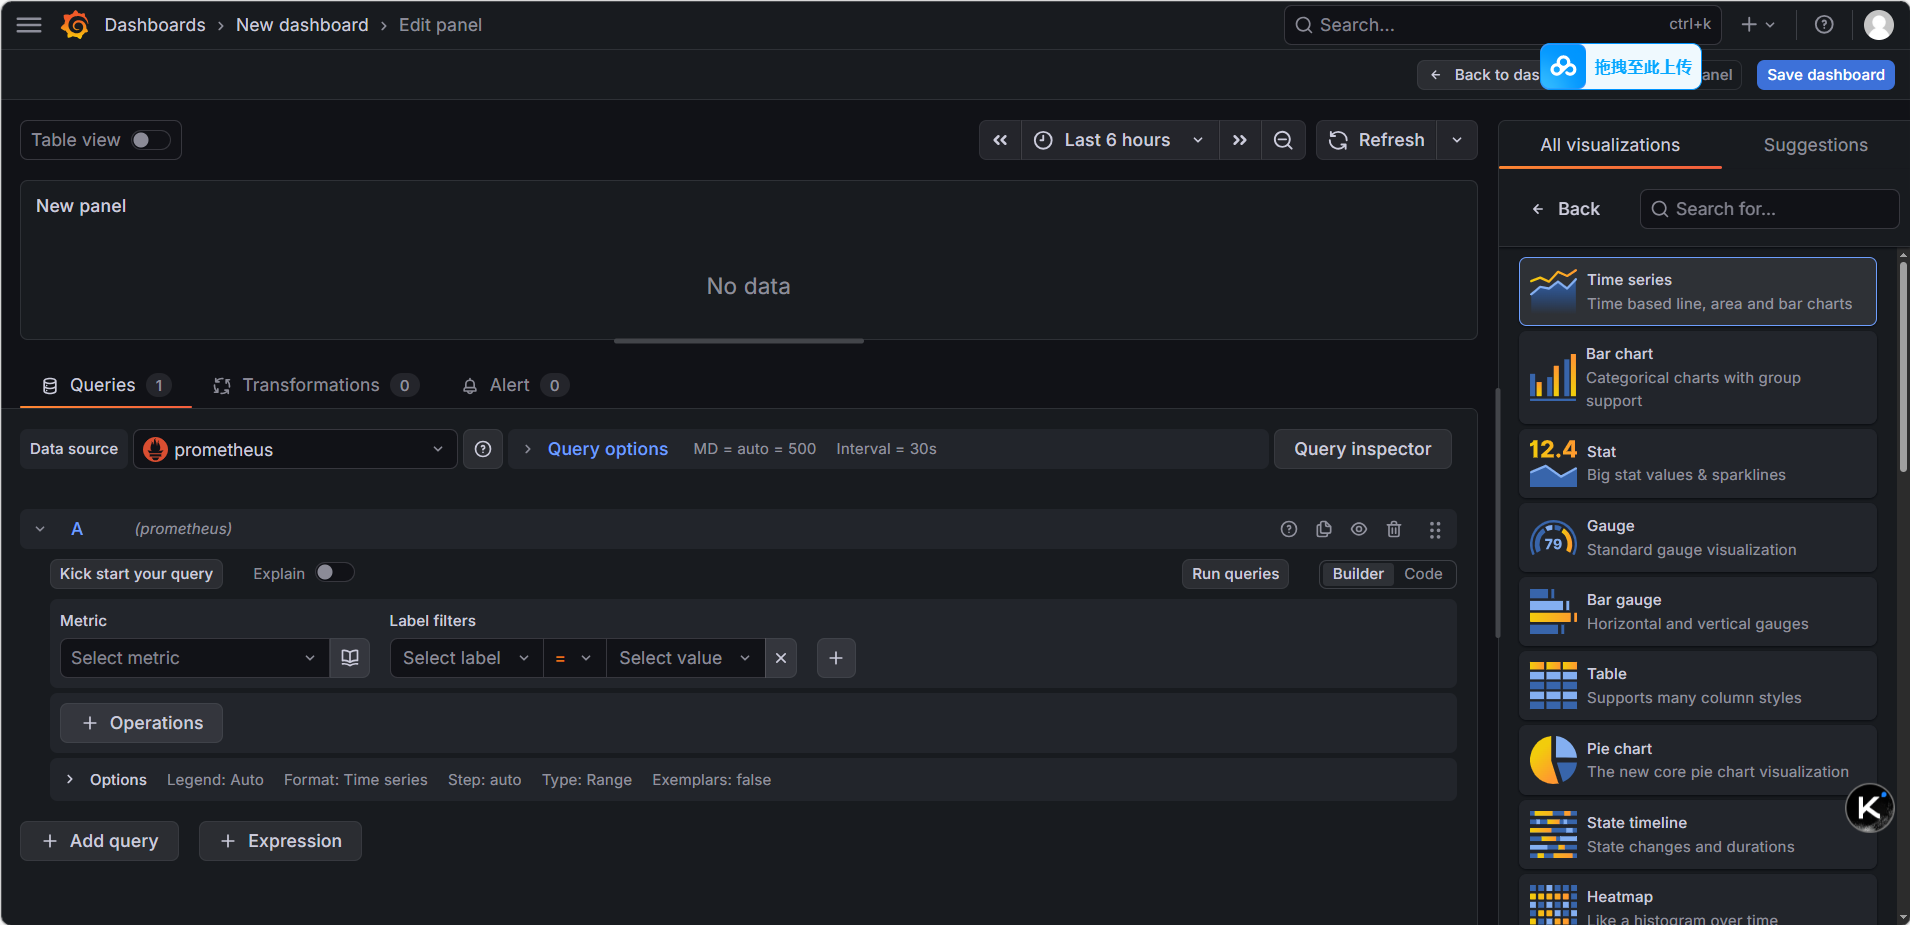
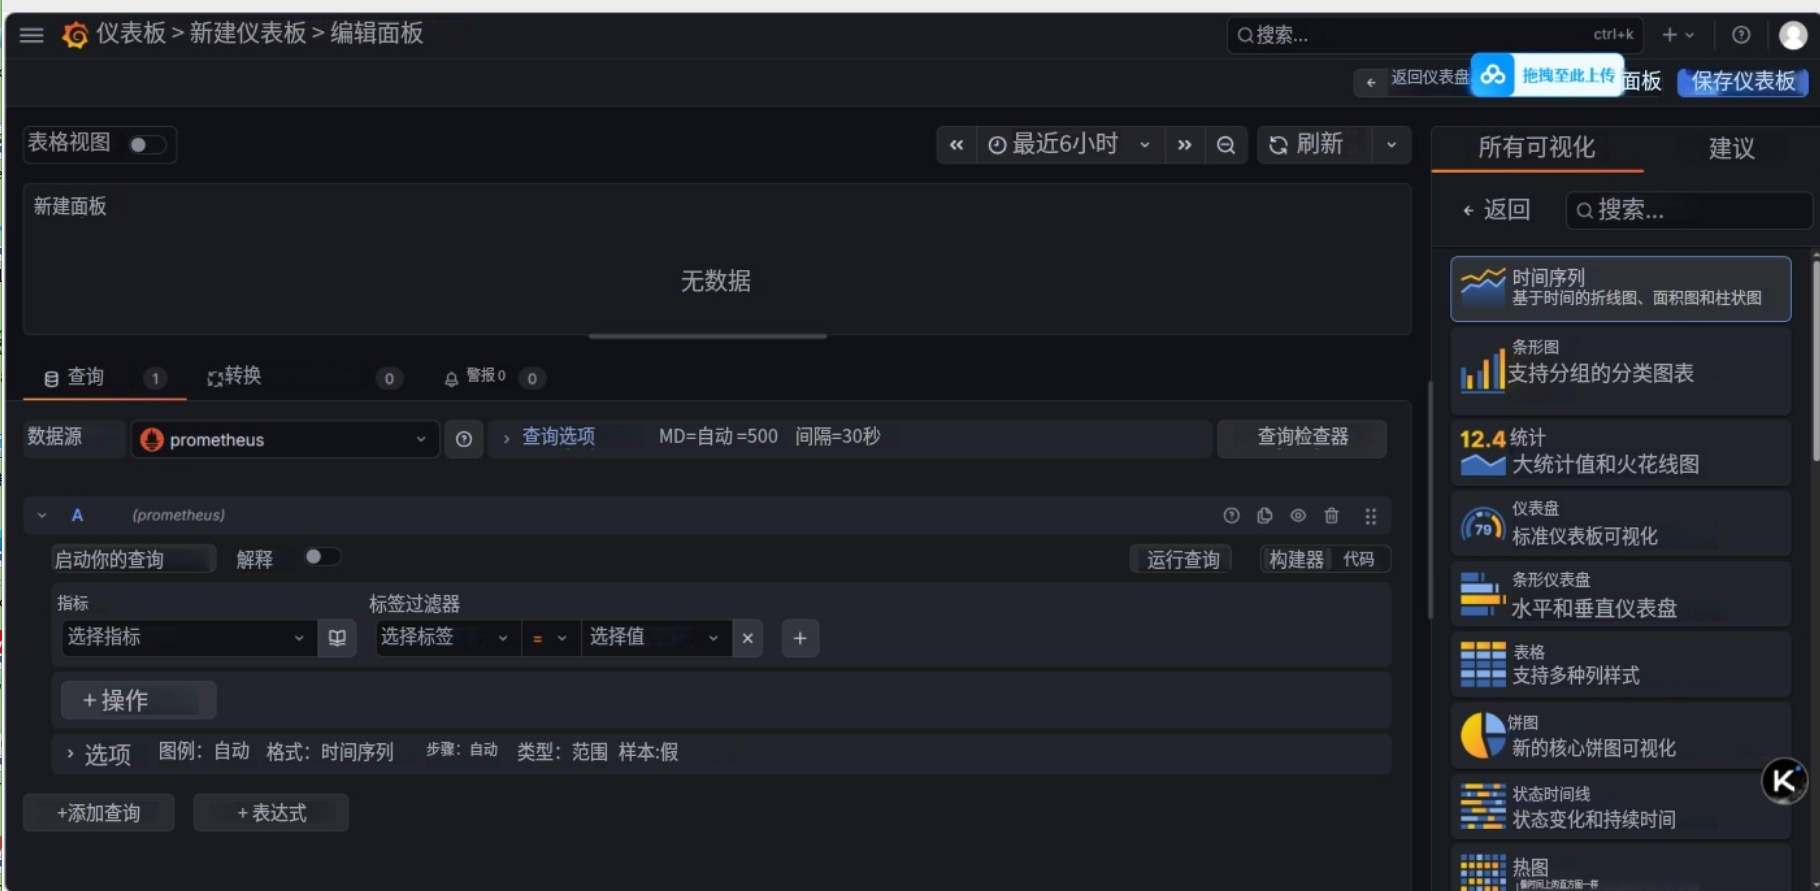
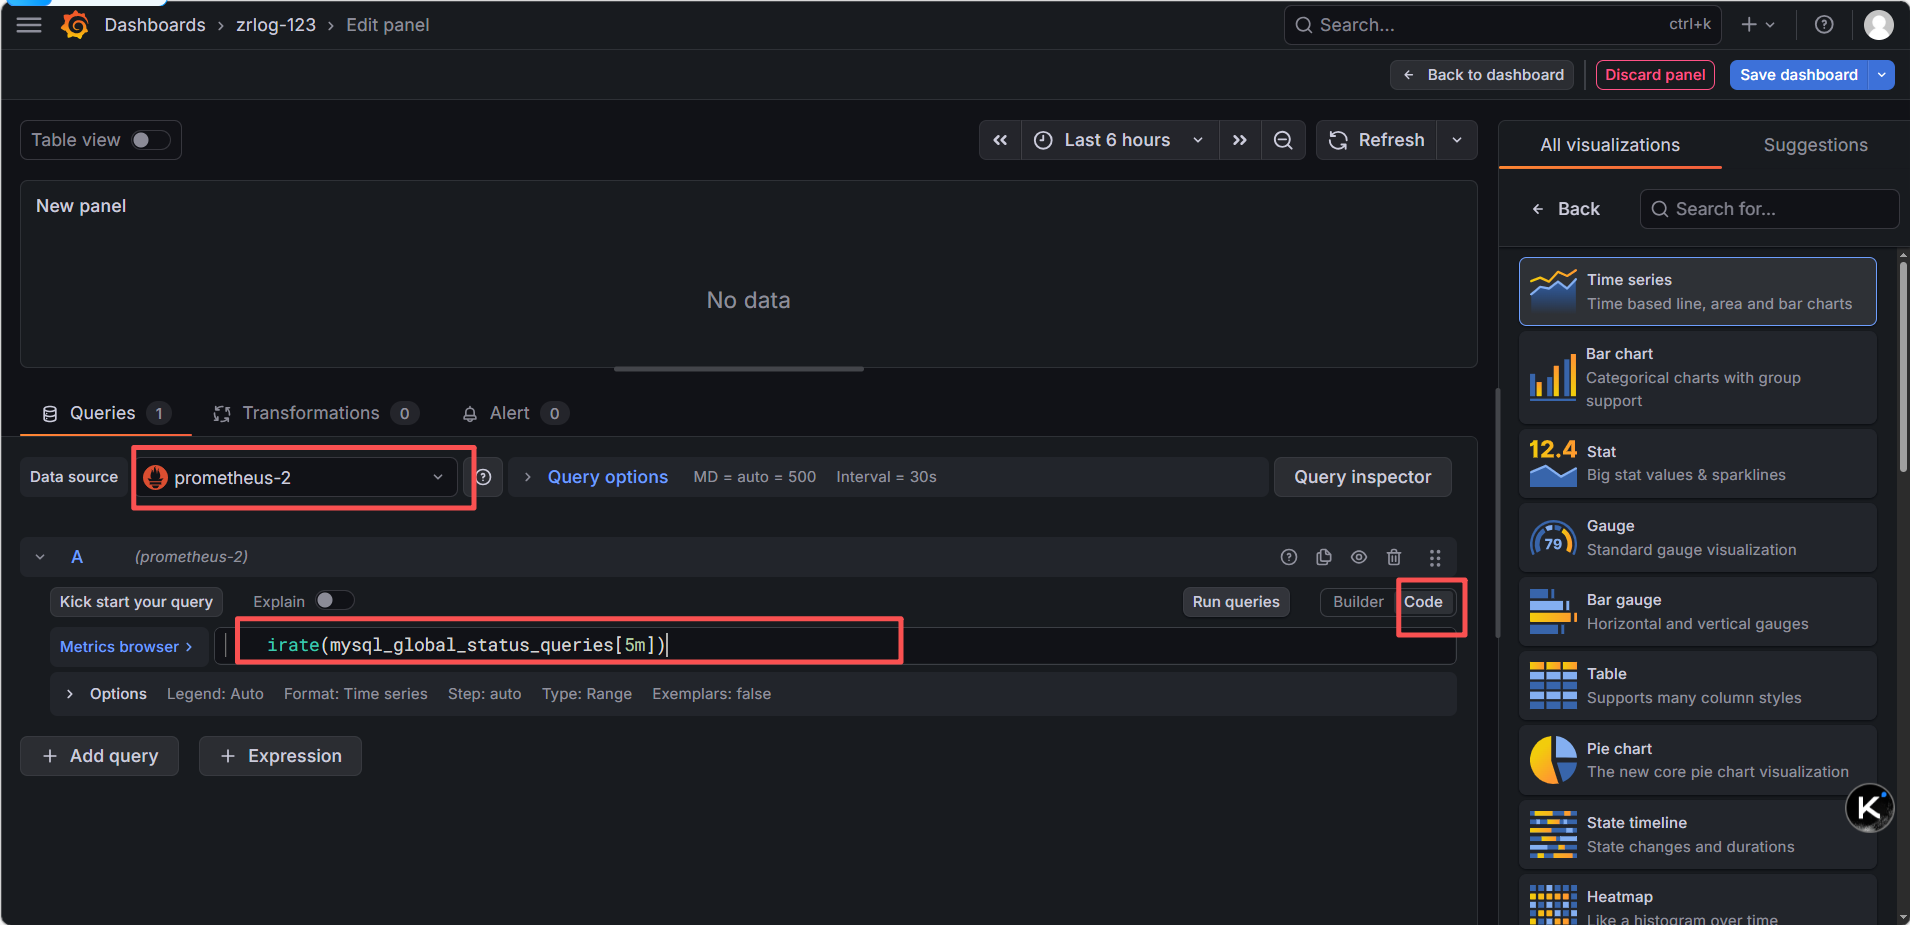
进入新建面板:你已经在
New dashboard > Edit panel页面,数据源也已经选了prometheus,这一步没问题切换到 Code 模式:点击
Code按钮,切换为手动输入模式输入 PromQL 语句:在文本框中输入你要的 PromQL,比如:
-
服务器 CPU 使用率:
100 - (avg by (instance) (irate(node_cpu_seconds_total{mode="idle"}[5m])) * 100) -
MySQL 连接数:
mysql_global_status_threads_connected -
内存使用率:
100 - (node_memory_MemAvailable_bytes / node_memory_MemTotal_bytes * 100)
执行查询:点击
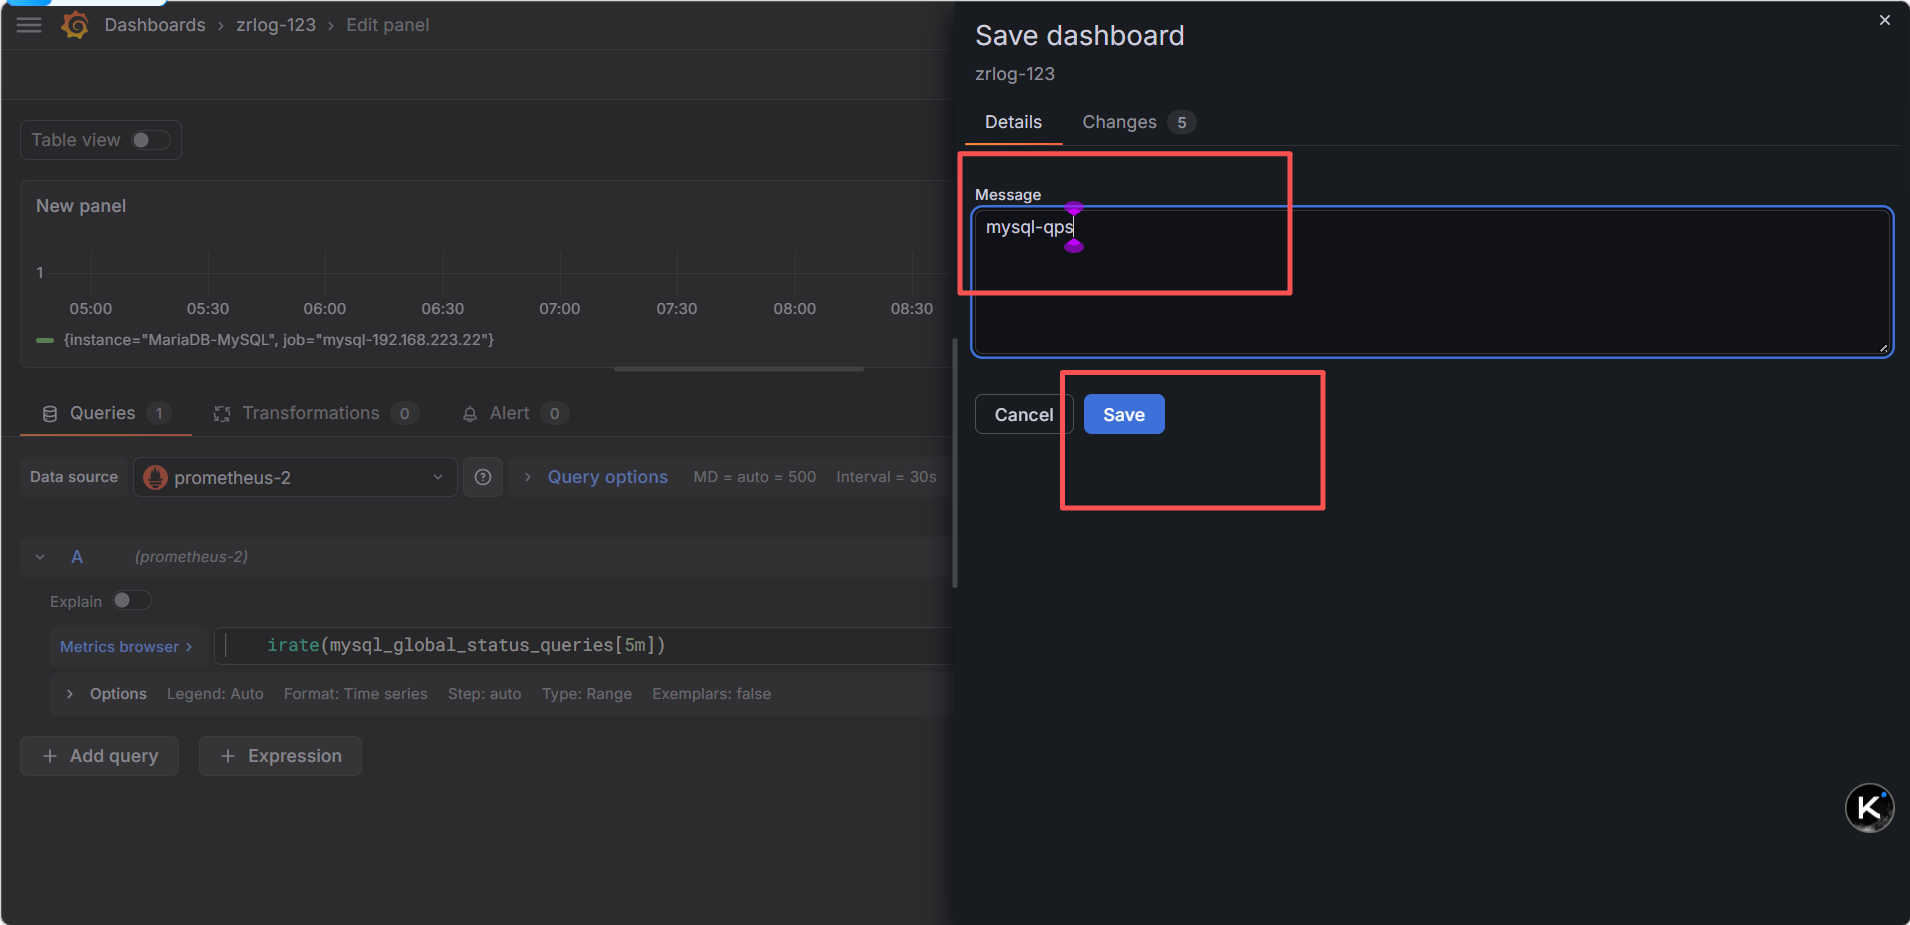
Run queries,就能看到数据,图表自动生成保存面板:点击右上角
Save dashboard保存即可 -
步骤 4:查看监控数据
-
左侧菜单 → Dashboards → Browse
-
选择导入 / 创建的面板,即可查看所有被监控节点的实时数据。
-
关键避坑
-
绝对不要把不同维度的指标放在同一个面板(比如 CPU% 和连接数个),会导致图表尺度混乱,完全没法看
-
每个面板只做一件事:一个面板只监控一个维度(CPU / 内存 / 磁盘 / MySQL),是专业监控的标准做法
-
拆分后,每个面板可以单独设置时间范围、单位、告警,灵活性更高
-
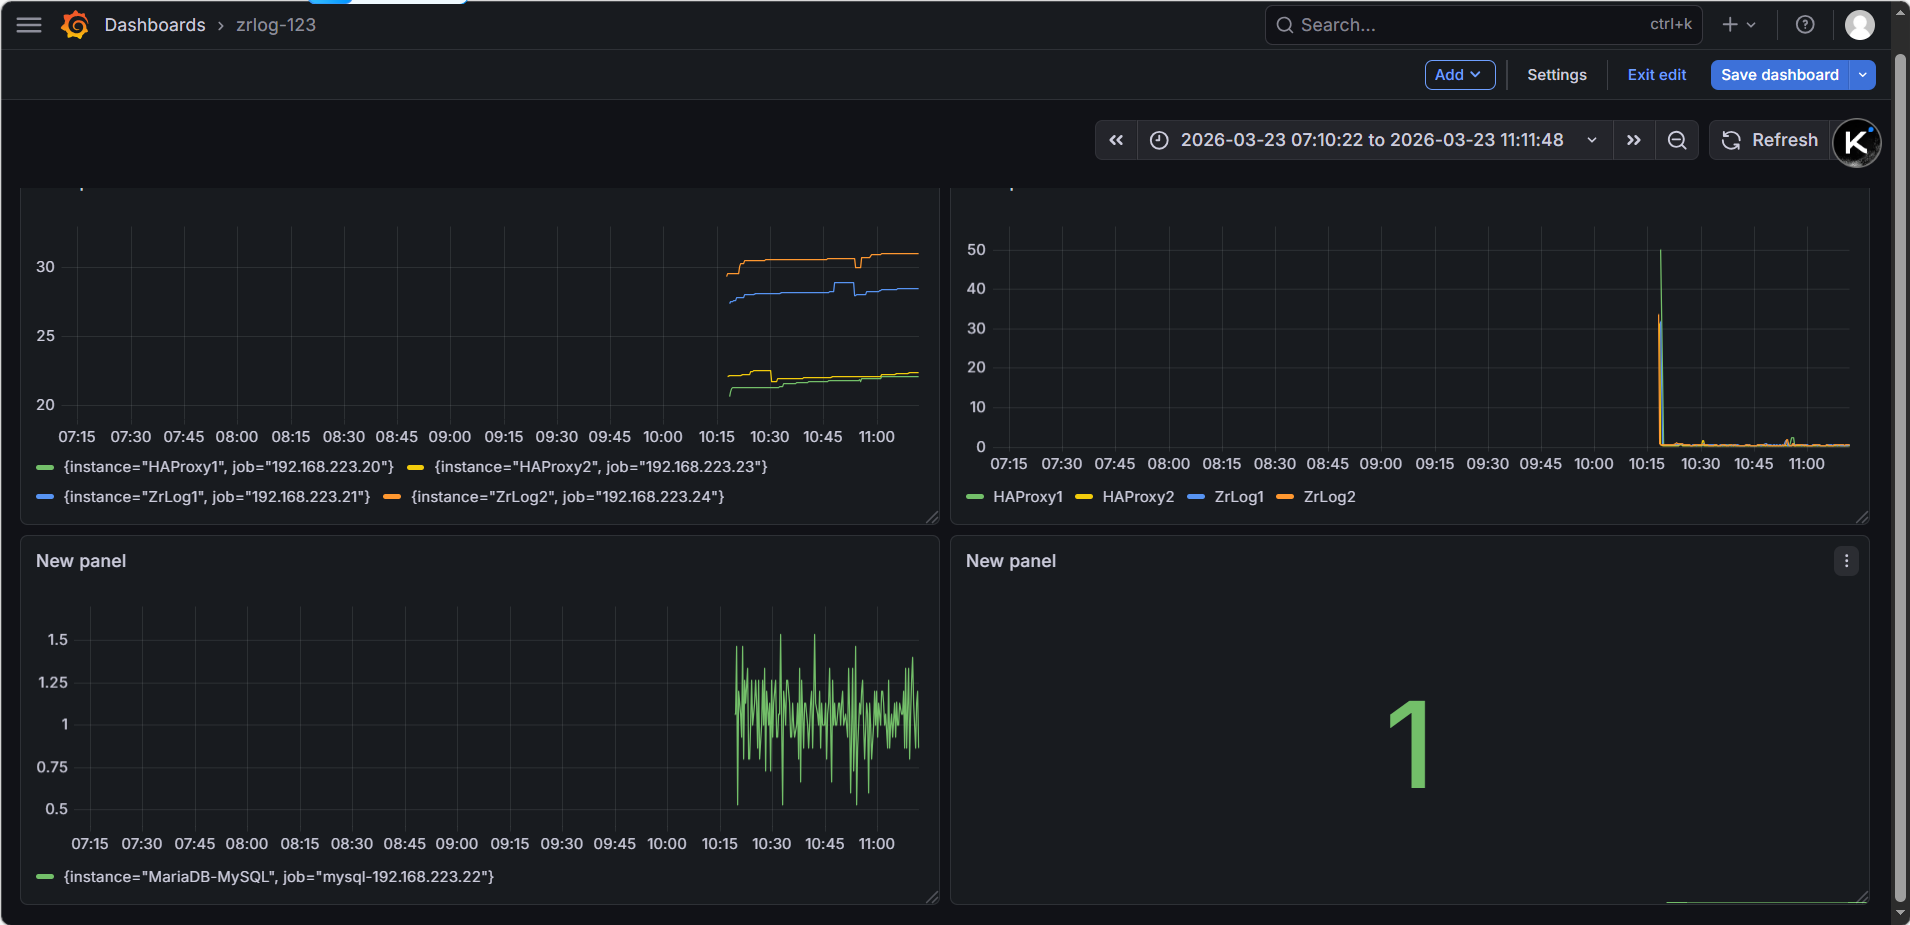
拆分后,你的仪表盘会变成两个独立面板,清晰不混乱:
| 面板位置 | 面板标题 | 监控内容 | 指标类型 |
|---|---|---|---|
| 上半部分 | 服务器 CPU 使用率 | 5 台服务器(20/21/22/23/24)的 CPU 使用率 | 系统指标 |
| 下半部分 | MySQL 当前连接数 | MariaDB 数据库的实时连接数 | 数据库指标 |
用 ZrLog 业务访问(最真实,模拟用户访问)
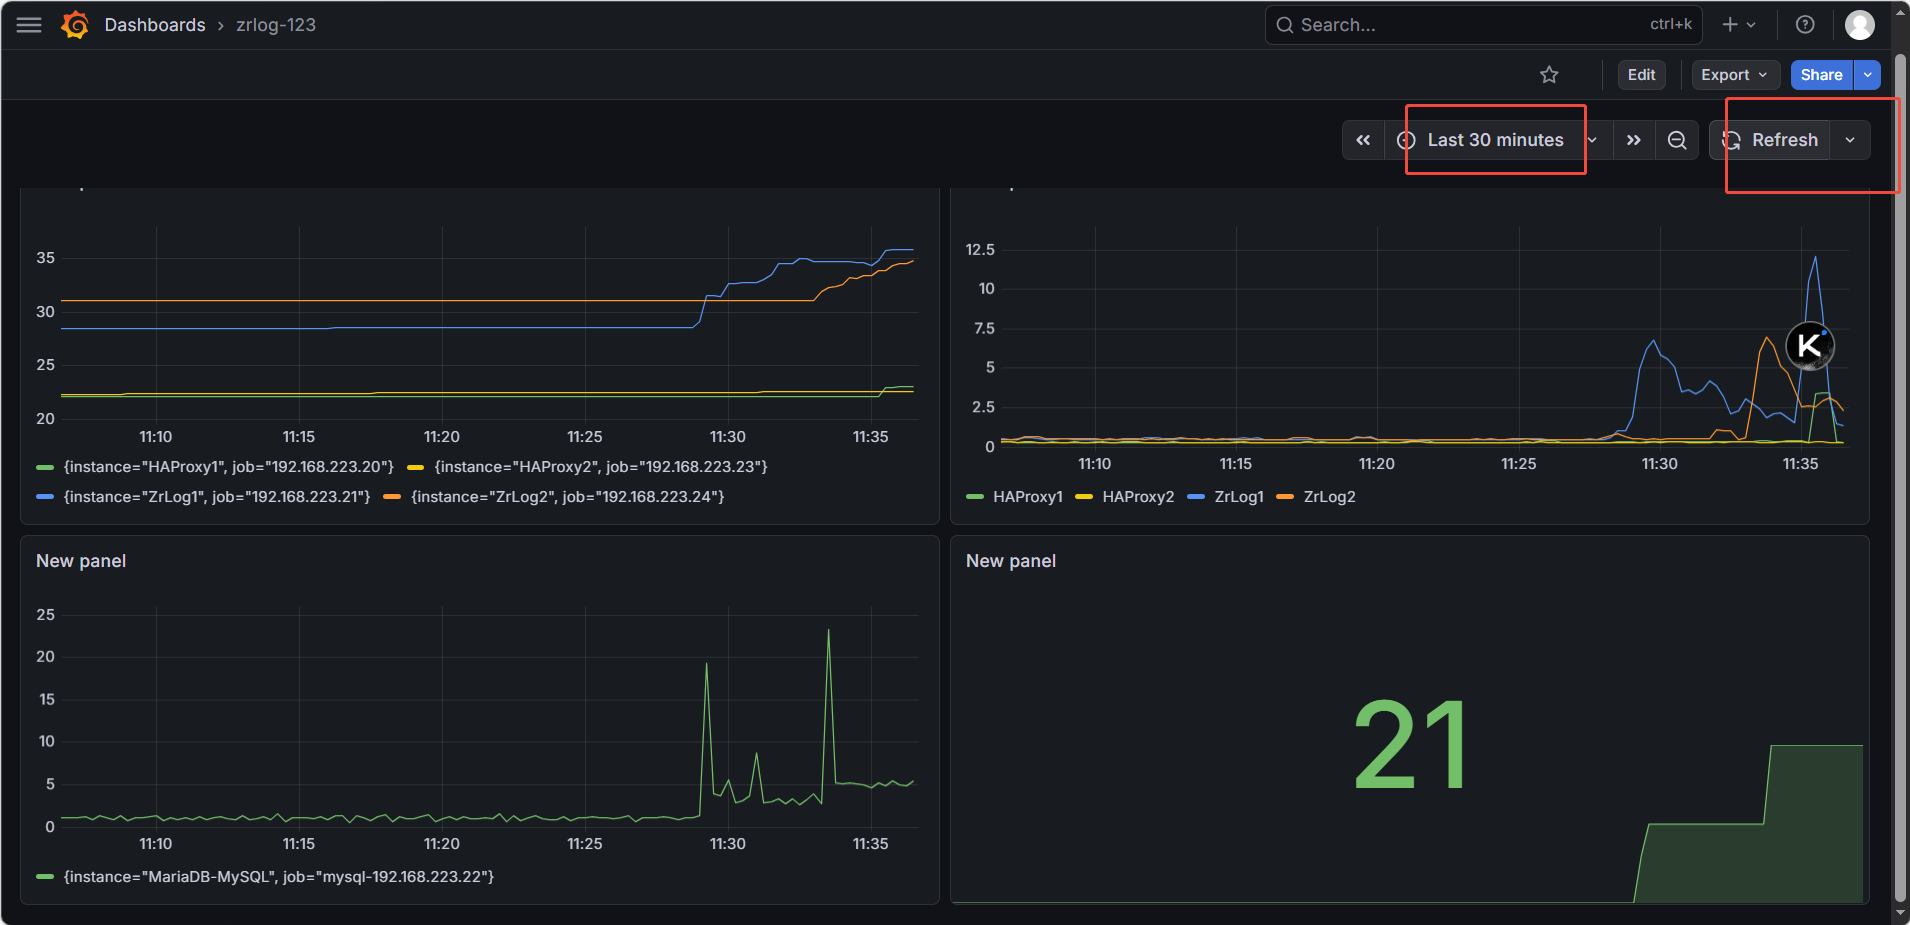
你的 ZrLog 应用依赖 MySQL,大量访问 ZrLog 网站,会让应用创建更多 MySQL 连接,连接数自然上升,完全是真实业务场景。
操作步骤:
-
用浏览器 / 压测工具(如
ab、jmeter),高频访问 VIP1/VIP2 的 ZrLog 网站(http://172.25.254.101、http://172.25.254.102) -
用
ab压测(在应用服务器 100/200执行):
# 安装ab工具(若没有) dnf install -y httpd-tools # 压测ZrLog,101并发,10000请求 ab -n 10000 -c 100 http://172.25.254.101/
压测期间,ZrLog 应用会持续创建 MySQL 连接,连接数面板直接上涨,完全模拟真实用户访问
3.3 Grafana面板优化(让它专业、易读)
1. 拆分面板(核心优化,必须做)
一个面板只放一个维度的指标,不要混放:
面板 1:服务器 CPU 使用率(保留你当前的 PromQL)
100 - (avg by (instance) (rate(node_cpu_seconds_total{mode="idle"}[1m])) * 100)
可视化:
Time series(折线图)标题:
服务器CPU使用率单位:
Percent (0-100)图例:改为
{{instance}},只显示服务器 IP / 别名面板 2:服务器内存使用率(新增)
100 - (node_memory_MemAvailable_bytes / node_memory_MemTotal_bytes * 100)
可视化:
Time series标题:
服务器内存使用率单位:
Percent (0-100)面板 3:MySQL 连接数(单独面板)
mysql_global_status_threads_connected{instance="192.168.223.22:9104"}
可视化:
Stat(大数字面板)或Time series标题:
MySQL当前连接数单位:
Short(显示数字)面板 4:MySQL QPS(新增,监控数据库性能)
irate(mysql_global_status_queries[5m])
可视化:
Time series标题:
MySQL QPS
2. 优化图表样式(让它更专业)
(1)修改时间范围
右上角
Last 6 hours→ 改为Last 30 minutes,只看最近有数据的时间段,图表更紧凑等监控运行 24 小时后,再改回
Last 24 hours看长期趋势(2)优化图例
在
Options→Legend中,输入{{instance}},只显示服务器 IP / 别名,去掉冗余的job标签比如:
HAProxy1、HAProxy2、ZrLog1、ZrLog2、MariaDB,一目了然(3)添加单位
在
Options→Unit中,选择Percent (0-100),让图表显示%,不用自己算MySQL 面板选择
Short,显示数字(4)修改面板标题
右侧
Panel options→Title,把New panel改成服务器CPU使用率,保存后看板更清晰
四、看板的正确使用姿势(运维视角)
1. 日常巡检(看什么)
CPU 使用率:正常服务器空载在 10%-30%,持续超过 80% 说明 CPU 负载过高,需要排查进程
内存使用率:正常在 30%-60%,持续超过 90% 说明内存不足,会导致 OOM
MySQL 连接数:正常在 10-50 之间,突然飙升说明有连接泄漏 / 异常请求
MySQL QPS:正常业务平稳,突然飙升说明有流量攻击 / 异常查询
2. 故障排查(怎么用)
服务器卡顿:看 CPU / 内存使用率,定位是哪台服务器负载高
网站打不开:看 HAProxy 节点的 CPU / 网络,确认负载均衡是否正常
数据库慢:看 MySQL 连接数、QPS、慢查询指标,定位数据库性能问题
五、给你一份「标准服务器监控大盘」布局
面板位置 指标 PromQL 可视化类型 左上 CPU 使用率 100 - (avg by (instance) (irate(node_cpu_seconds_total{mode="idle"}[5m])) * 100)Time series 右上 内存使用率 100 - (node_memory_MemAvailable_bytes / node_memory_MemTotal_bytes * 100)Time series 左中 磁盘使用率 100 - (node_filesystem_avail_bytes{mountpoint="/"} / node_filesystem_size_bytes{mountpoint="/"} * 100)Time series 右中 网络流量 irate(node_network_receive_bytes_total[5m])/1024/1024Time series 左下 MySQL 连接数 mysql_global_status_threads_connectedStat 右下 MySQL QPS irate(mysql_global_status_queries[5m])Time series
四、验证监控
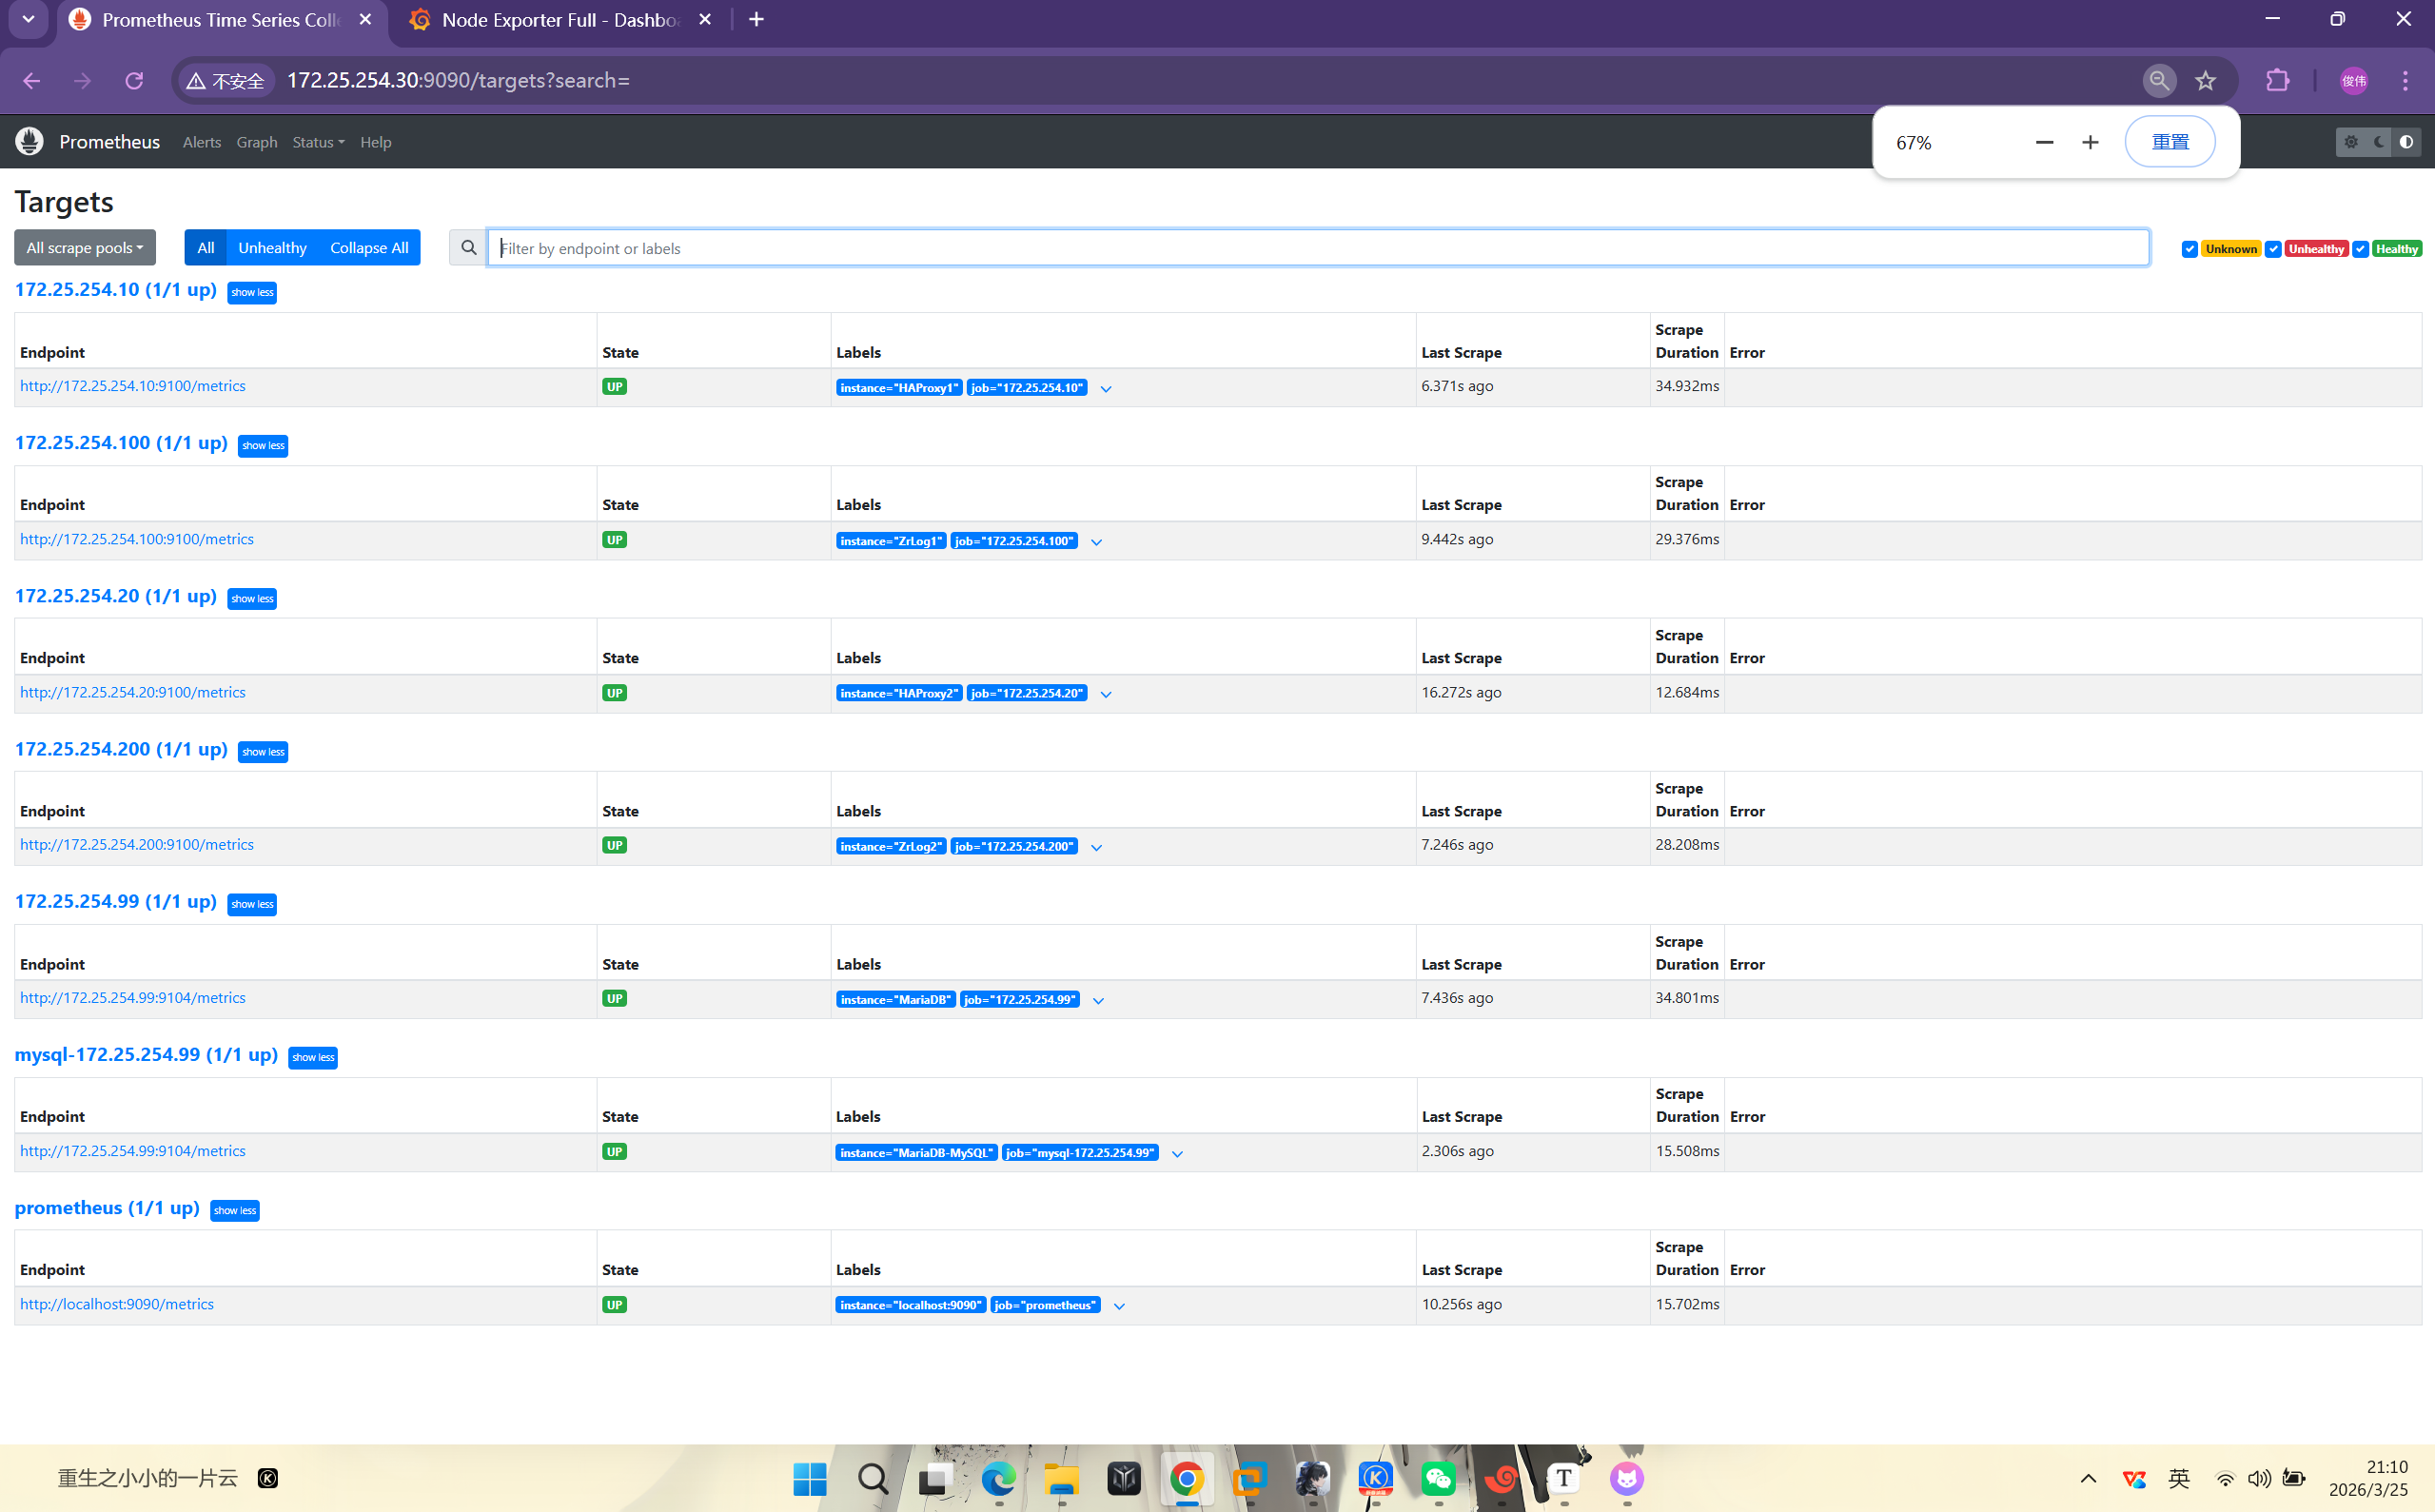
4.1 检查 Prometheus Targets
-
浏览器访问:
http://192.168.223.25:9090/targets -
所有 Target 状态需为 UP:
-
prometheus-server
-
HAProxy1 (172.25.254.10)
-
ZrLog1 (172.25.254.100)
-
MariaDB (172.25.254.99)
-
HAProxy2 (172.25.254.20)
-
ZrLog2 (172.25.254.200)
-
-
若 Target 为 DOWN:
-
检查目标节点 node_exporter 是否启动;
-
检查目标节点 9100 端口是否监听;
-
检查监控服务器与目标节点网络是否互通(ping + telnet 目标 IP 9100)。
-
4.1 补充:验证 MySQL 监控状态
访问 Prometheus Targets:
http://172.25.254.30:9090/targets
检查:
mysql-172.25.254.30(172.25.254.30:9104) → 状态 UP
4.2 验证监控指标
-
Prometheus 页面点击 Graph,输入以下指标验证数据是否存在:
-
node_cpu_seconds_total(CPU 使用时间) -
node_memory_MemTotal_bytes(内存总量) -
node_disk_read_bytes_total(磁盘读取) -
node_network_receive_bytes_total(网络接收)
-
-
若无数据:
-
检查 Prometheus 配置文件中 targets IP 是否正确;
-
检查 scrape_interval 是否过短(等待 15s 后重试);
-
查看 Prometheus 日志是否有抓取错误。
-
五、常用查询
5.1 系统指标
# CPU 使用率(按实例分组,5分钟均值)
100 - (avg by (instance) (rate(node_cpu_seconds_total{mode="idle"}[5m])) * 100)

# 内存使用率(按实例分组)
(node_memory_MemTotal_bytes - node_memory_MemAvailable_bytes) / node_memory_MemTotal_bytes * 100

# 磁盘使用率(根目录,按实例分组)
100 - (node_filesystem_avail_bytes{mountpoint="/"} / node_filesystem_size_bytes{mountpoint="/"} * 100)

# 系统负载(按实例分组)
node_load1 / count(node_cpu_seconds_total{mode="idle"}) by (instance)
5.2 网络指标
# 网络接收速率 (MB/s,按实例+网卡分组)
rate(node_network_receive_bytes_total[1m]) / 1024 / 1024

# 网络发送速率 (MB/s,按实例+网卡分组)
rate(node_network_transmit_bytes_total[1m]) / 1024 / 1024
5.3 进程指标
# 系统运行时间(秒)
time() - node_time_seconds{} + node_boot_time_seconds{}

# 进程打开文件数(按实例分组)
process_open_fds{}
六、端口说明
| 服务 | 端口 | 用途 | 放行规则(若开启防火墙) |
|---|---|---|---|
| Prometheus | 9090 | 监控数据查询 | firewall-cmd --add-port=9090/tcp --permanent |
| Grafana | 3000 | 可视化界面 | firewall-cmd --add-port=3000/tcp --permanent |
| node_exporter | 9100 | 系统指标导出 | firewall-cmd --add-port=9100/tcp --permanent |
七、监控架构图
                    ┌─────────────────┐
                    │   Grafana       │
                    │  172.25.254.30  │
                    │    :3000         │
                    └────────┬────────┘
                             │
                    ┌────────▼────────┐
                    │   Prometheus     │
                    │  172.25.254.30   │
                    │    :9090          │
                    └────────┬────────┘
                             │
         ┌───────────────────┼───────────────────┐
         │                   │                   │
    ┌────▼────┐        ┌────▼────┐        ┌────▼────┐
    │ HAProxy1 │        │  ZrLog1  │        │ MariaDB  │
    │172.25.254.10│     │172.25.254.100│     │172.25.254.99│
    │   :9100  │        │   :9100  │        │   :9100  │
    └──────────┘        └──────────┘        └──────────┘
         │                   │                   │
         │                   │                   │
    ┌────▼────┐        ┌────▼────┐        ┌────▼────┐
    │ HAProxy2 │        │  ZrLog2  │        │         │
    │172.25.254.20│     │172.25.254.200│     │         │
    │   :9100  │        │   :9100  │        │         │
    └──────────┘        └──────────┘        └──────────┘
八、常见故障排查
8.1 Prometheus 启动失败
| 现象 | 排查步骤 | |
|---|---|---|
| 端口占用 | netstat -tulpn | grep 9090 → 杀死占用进程 | |
| 配置语法错误 | promtool check config /root/prometheus/prometheus.yml → 修正 YAML 缩进 / 语法 | |
| 目录权限不足 | chmod 755 /root/prometheus -R → 重新启动 | |
| 日志报错 | tail -20 /root/prometheus.log → 定位具体错误 |
8.2 Grafana 无法访问
| 现象 | 排查步骤 |
|---|---|
| 3000 端口未监听 | systemctl status grafana-server → 修复启动故障(如安装 libfontconfig 依赖) |
| 数据源连接失败 | 检查 Prometheus 是否启动、9090 端口是否互通、URL 是否填写正确 |
| 导入面板失败(离线) | 改用离线导入方式,上传 JSON 文件 |
8.3 node_exporter Target 显示 DOWN
| 现象 | 排查步骤 | |
|---|---|---|
| 9100 端口未监听 | 目标节点执行 ps -ef | grep node_exporter → 重新启动 | |
| 网络不通 | 监控服务器 ping 目标 IP + telnet 目标IP 9100 → 检查防火墙 / SELinux | |
| 启动命令错误 | 确认启动命令绑定 0.0.0.0(而非 127.0.0.1) |
九、相关部署文档
-
/root/部署zrlog-haproxy反向代理keepalived双主双从.md- ZrLog 主架构部署 -
/root/监控故障排查手册.md- 本部署配套排查指南

北京人形旗下天工造物具身智能开源社区,聚焦具身天工与慧思开物两大平台
更多推荐
 8
8 0
0- 0


 已为社区贡献2条内容

所有评论(0)