企业运维实战--ELK日志分析平台之kibana数据可视化
企业运维实战--ELK日志分析平台之kibana数据可视化
前言–kibana简介
kibana 是一款开源的数据分析和可视化平台,它是 Elastic Stack 成员之一,设计用于和 Elasticsearch 协作。您可以使用 Kibana 对 Elasticsearch 索引中的数据进行搜索、查看、交互操作。您可以很方便的利用图表、表格及地图对数据进行多元化的分析和呈现。
kibana数据可视化
安装rpm包
rpm -ivh kibana-7.6.1-x86_64.rpm

编辑主配文件
vim /etc/kibana/kibana.yml
server.port: 5601
server.host: "172.25.9.7"
elasticsearch.hosts: ["http://172.25.9.4:9200"]
i18n.locale: "zh-CN"

等待端口启动
netstat -antlp |grep :5601

过滤插件拉起logstash
/usr/share/logstash/bin/logstash -f grok.conf
网页访问http://172.25.9.7:5601

创建索引匹配

创建可视化

访问次数可视化


压力测试访问:
ab -n 100 -c1 http://172.25.9.7/index.html

refresh后次数会发生实时变化

测试完成后记得保存

访问数前五名柱状图可视化

设置x轴


保存

创建dashboard

将创建的可视化加入dashboard


保存新建的dashboard

查看界面

压力测试


集群信息采集之内部采集方式

首次进入会报错,原因是未开启xpack安全验证
启用xpack安全验证
elasticsearch集群节点创建证书
cd /usr/share/elasticsearch/
bin/elasticsearch-certutil ca
bin/elasticsearch-certutil cert --ca elastic-stack-ca.p12
cp elastic-certificates.p12 elastic-stack-ca.p12 /etc/elasticsearch
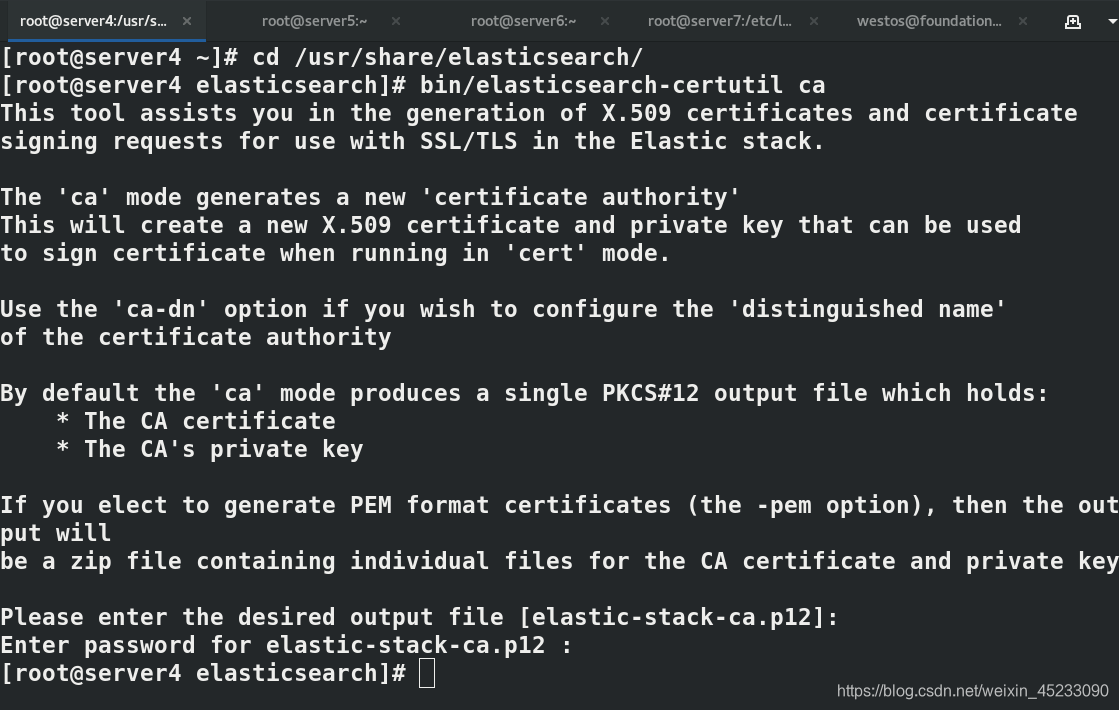
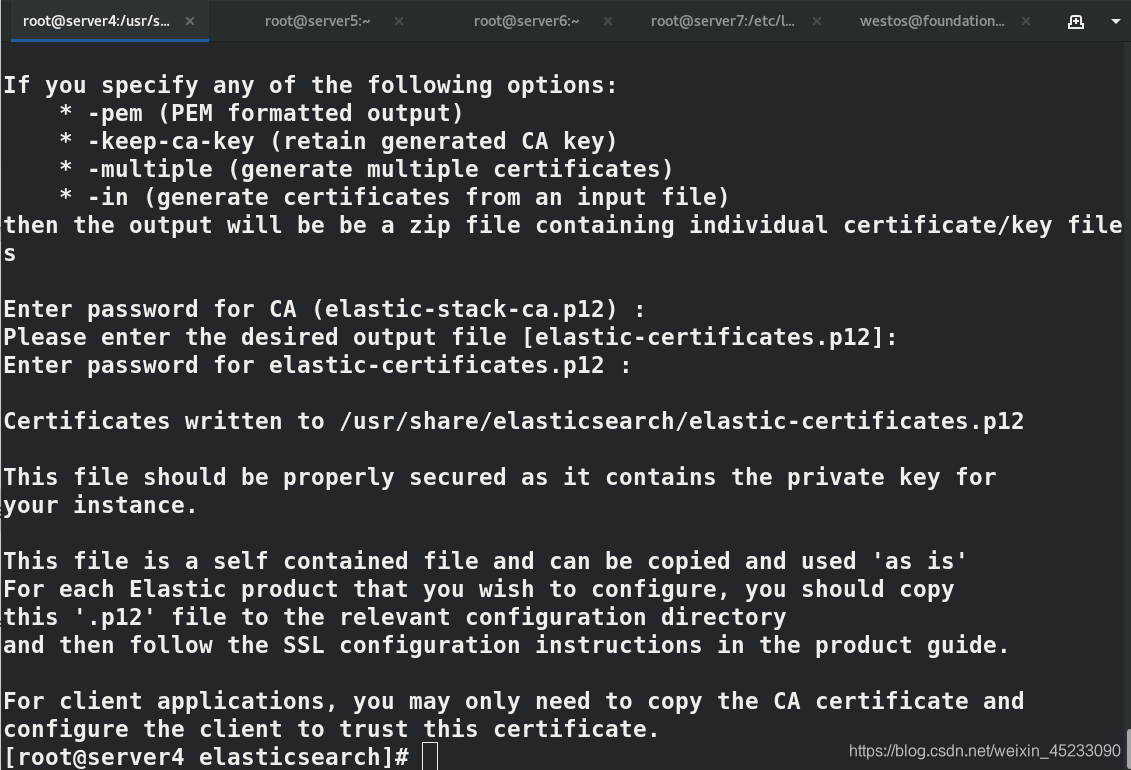
修改权限
cd /etc/elasticsearch
chown elasticsearch elastic-certificates.p12 elastic-stack-ca.p12
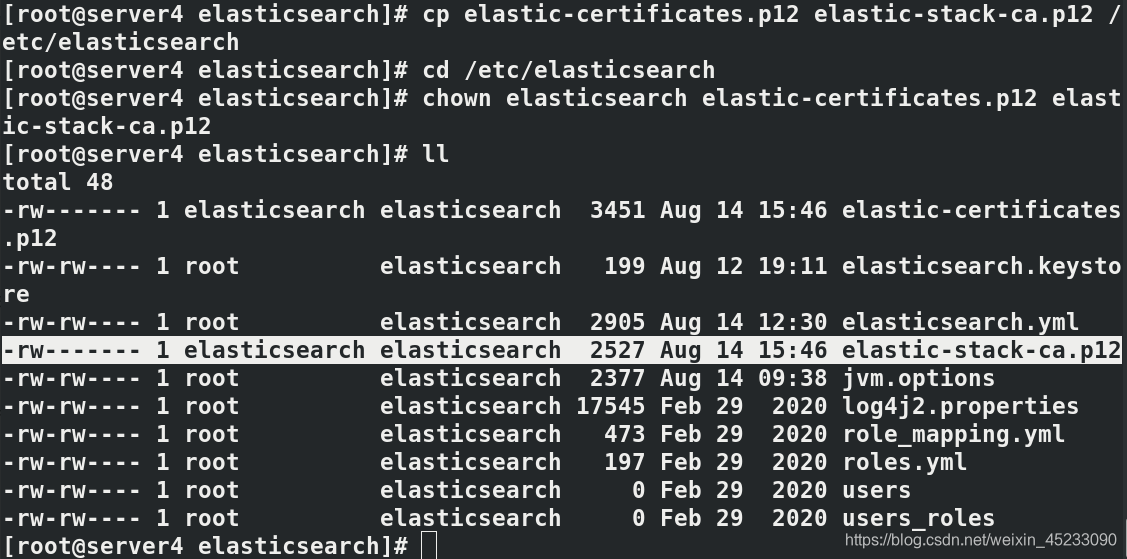
添加内部信息采集参数到ES集群,每一个ES集群节点都需要操作
vim /etc/elasticsearch/elasticsearch.yml
xpack.security.enabled: true
xpack.security.transport.ssl.enabled: true
xpack.security.transport.ssl.verification_mode: certificate
xpack.security.transport.ssl.keystore.path: /etc/elasticsearch/elastic-certificates.p12
xpack.security.transport.ssl.truststore.path: /etc/elasticsearch/elastic-certificates.p12

重启集群
systemctl restart elasticsearch.service
集群启动正常后,设置用户密码:
cd /usr/share/elasticsearch/bin/
./elasticsearch-setup-passwords interactive
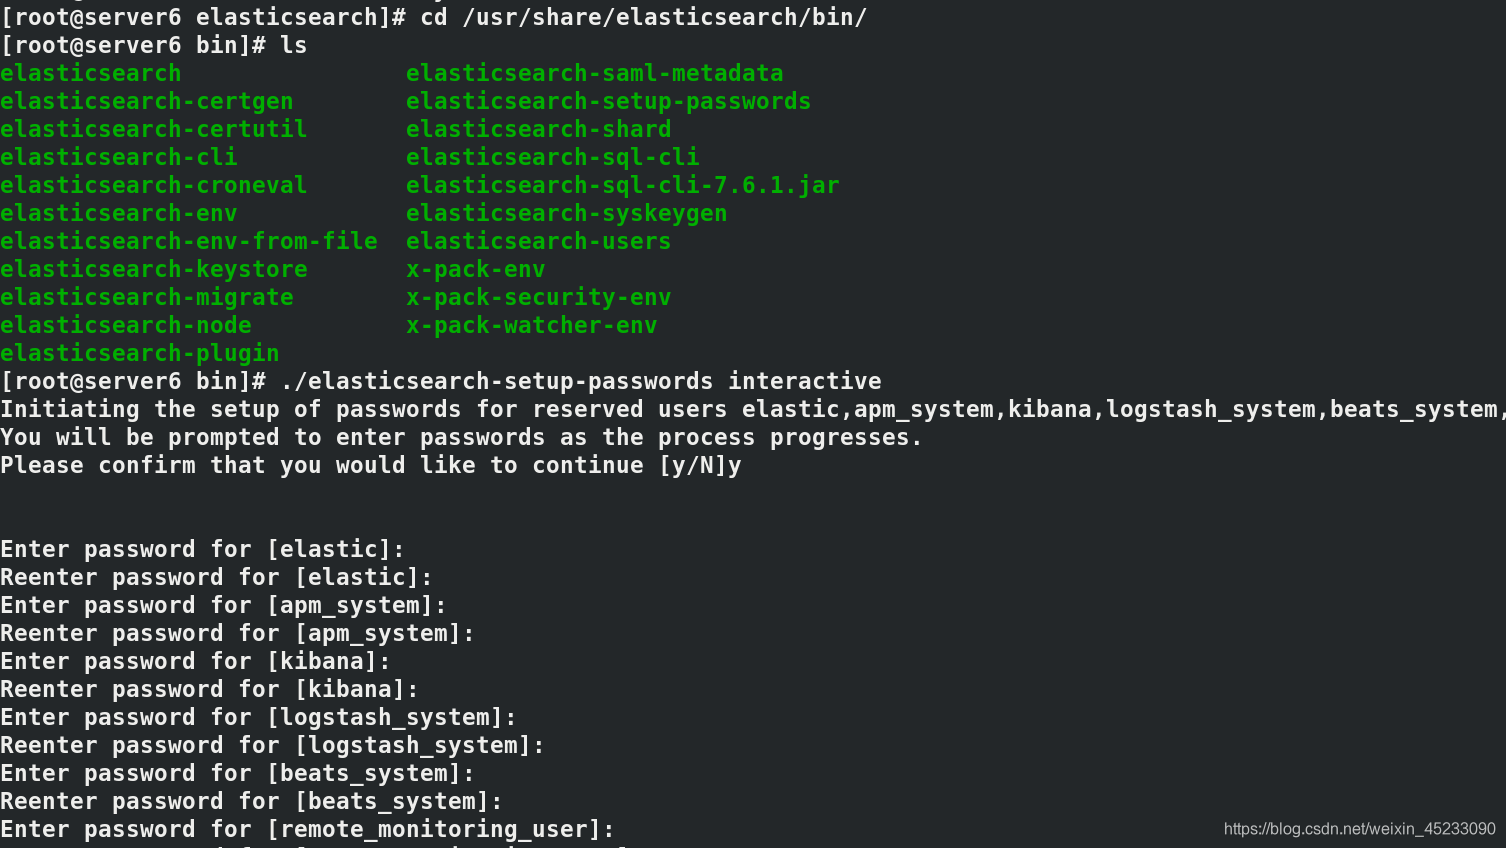
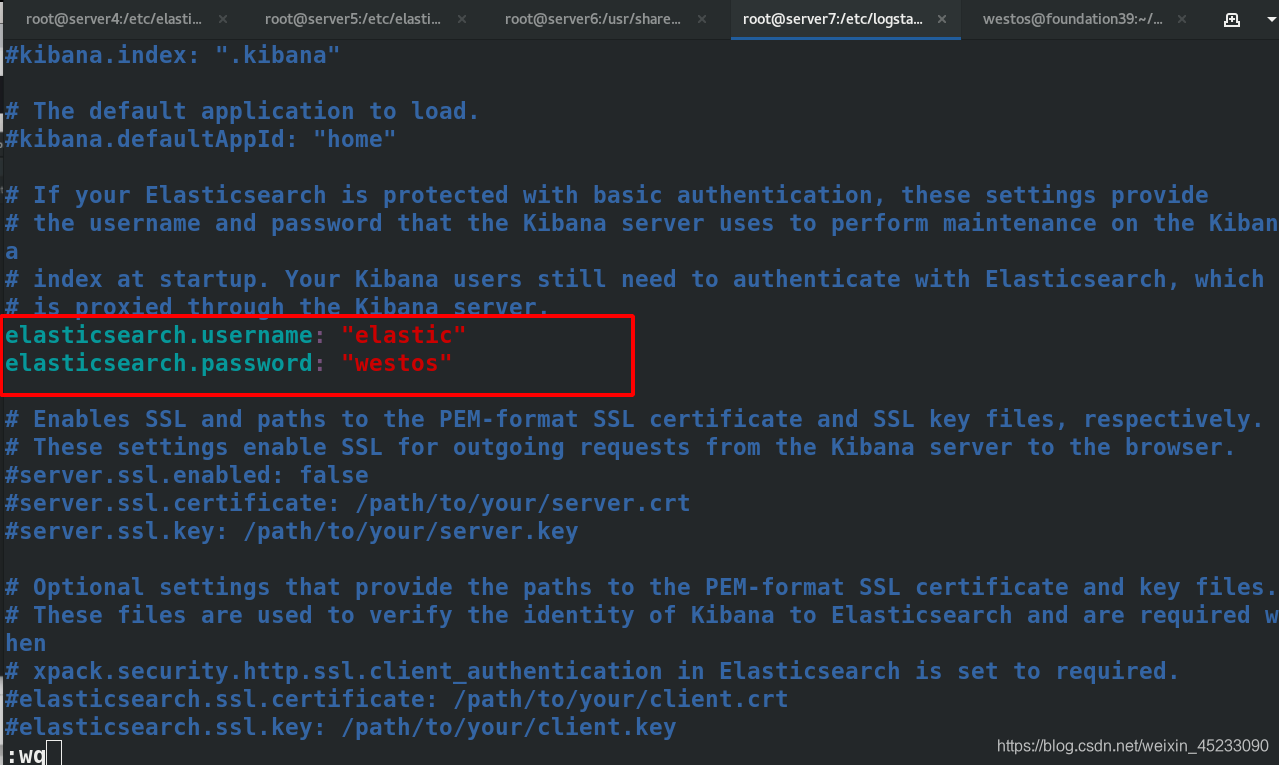
kibana连接es集群的用户密码写入kibana主配文件
vim /etc/kibana/kibana.yml
elasticsearch.username: "kibana"
elasticsearch.password: "westos"

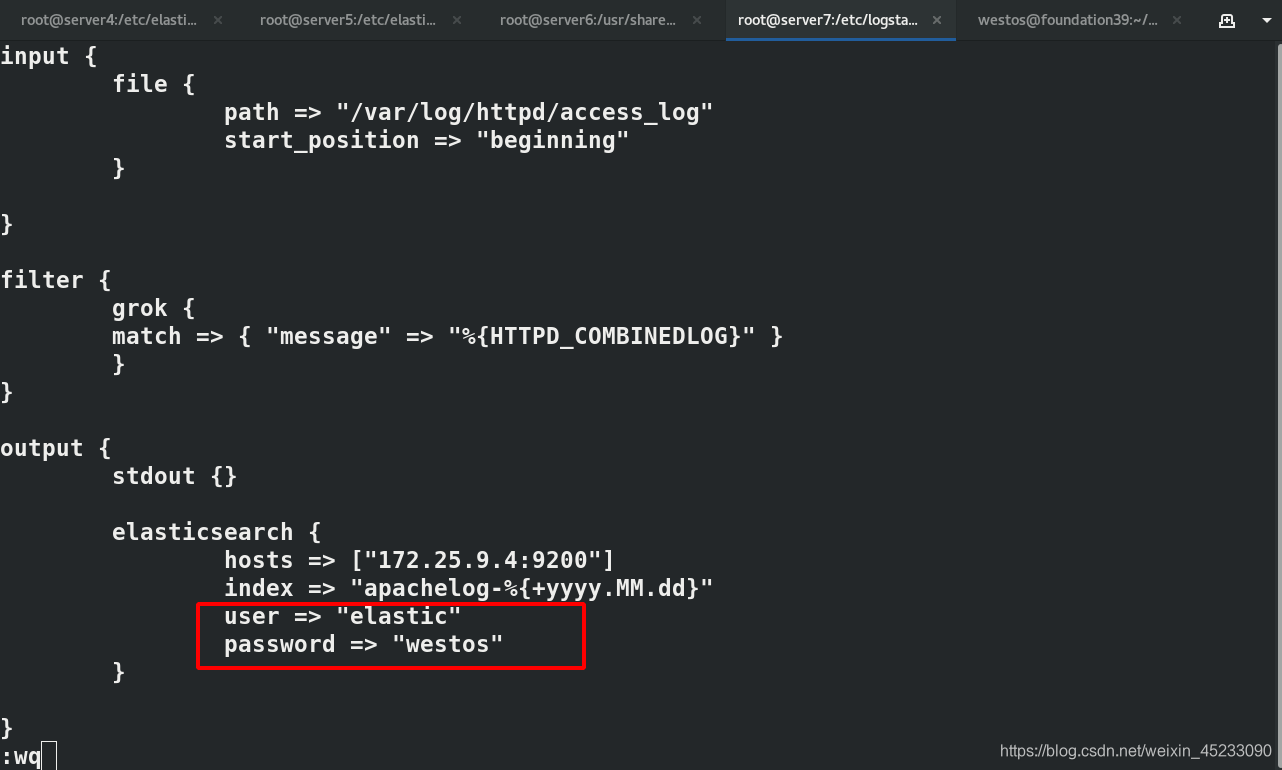
设置Logstash连接ES用户密码:
input {
        file {
                path => "/var/log/httpd/access_log"
                start_position => "beginning"
        }

}

filter {
        grok {
        match => { "message" => "%{HTTPD_COMBINEDLOG}" }
        }
}

output {
        stdout {}

        elasticsearch {
                hosts => ["172.25.9.4:9200"]
                index => "apachelog-%{+yyyy.MM.dd}"
                user => "elastic"
                password => "westos"
        }

}
此时的监控是无法采集信息的
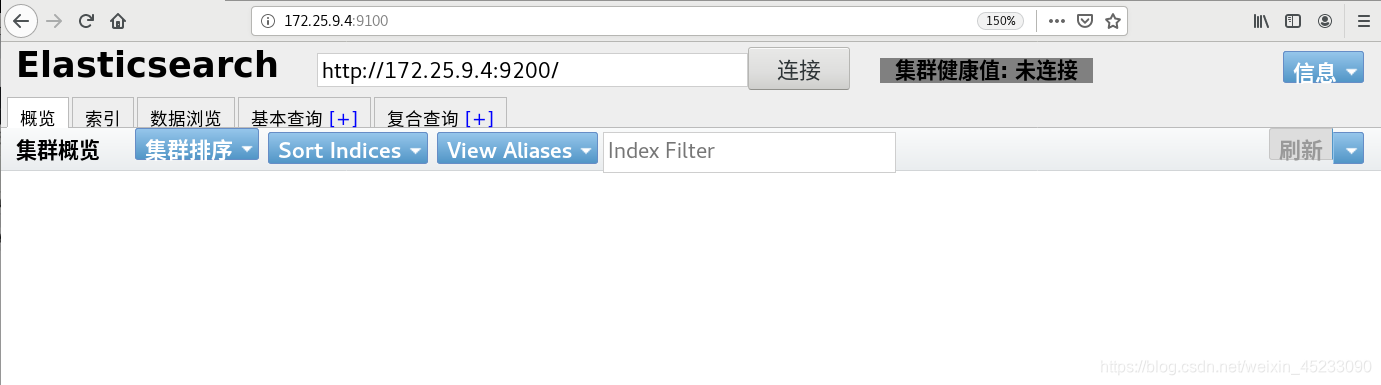
监控设置:
主配添加:
http.cors.allow-headers: Authorization,X-Requested-With,Content-Length,Content-Type #添加参数到es配置


监控访问需要认证http://172.25.0.13:9100/?auth_user=elastic&auth_password=westos
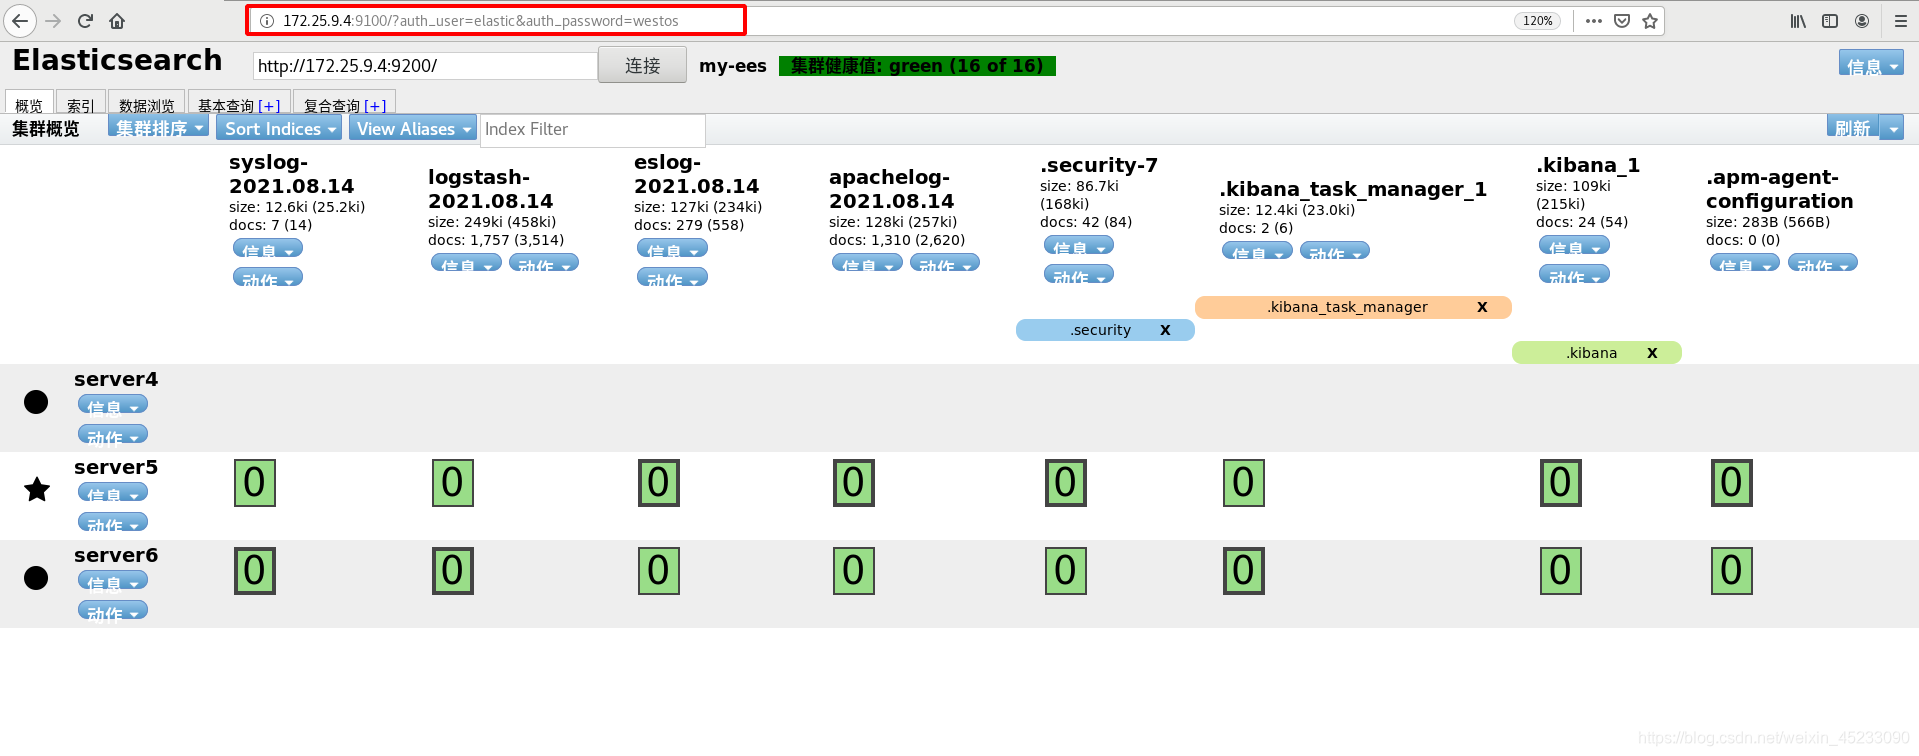
内部采集页面展示:
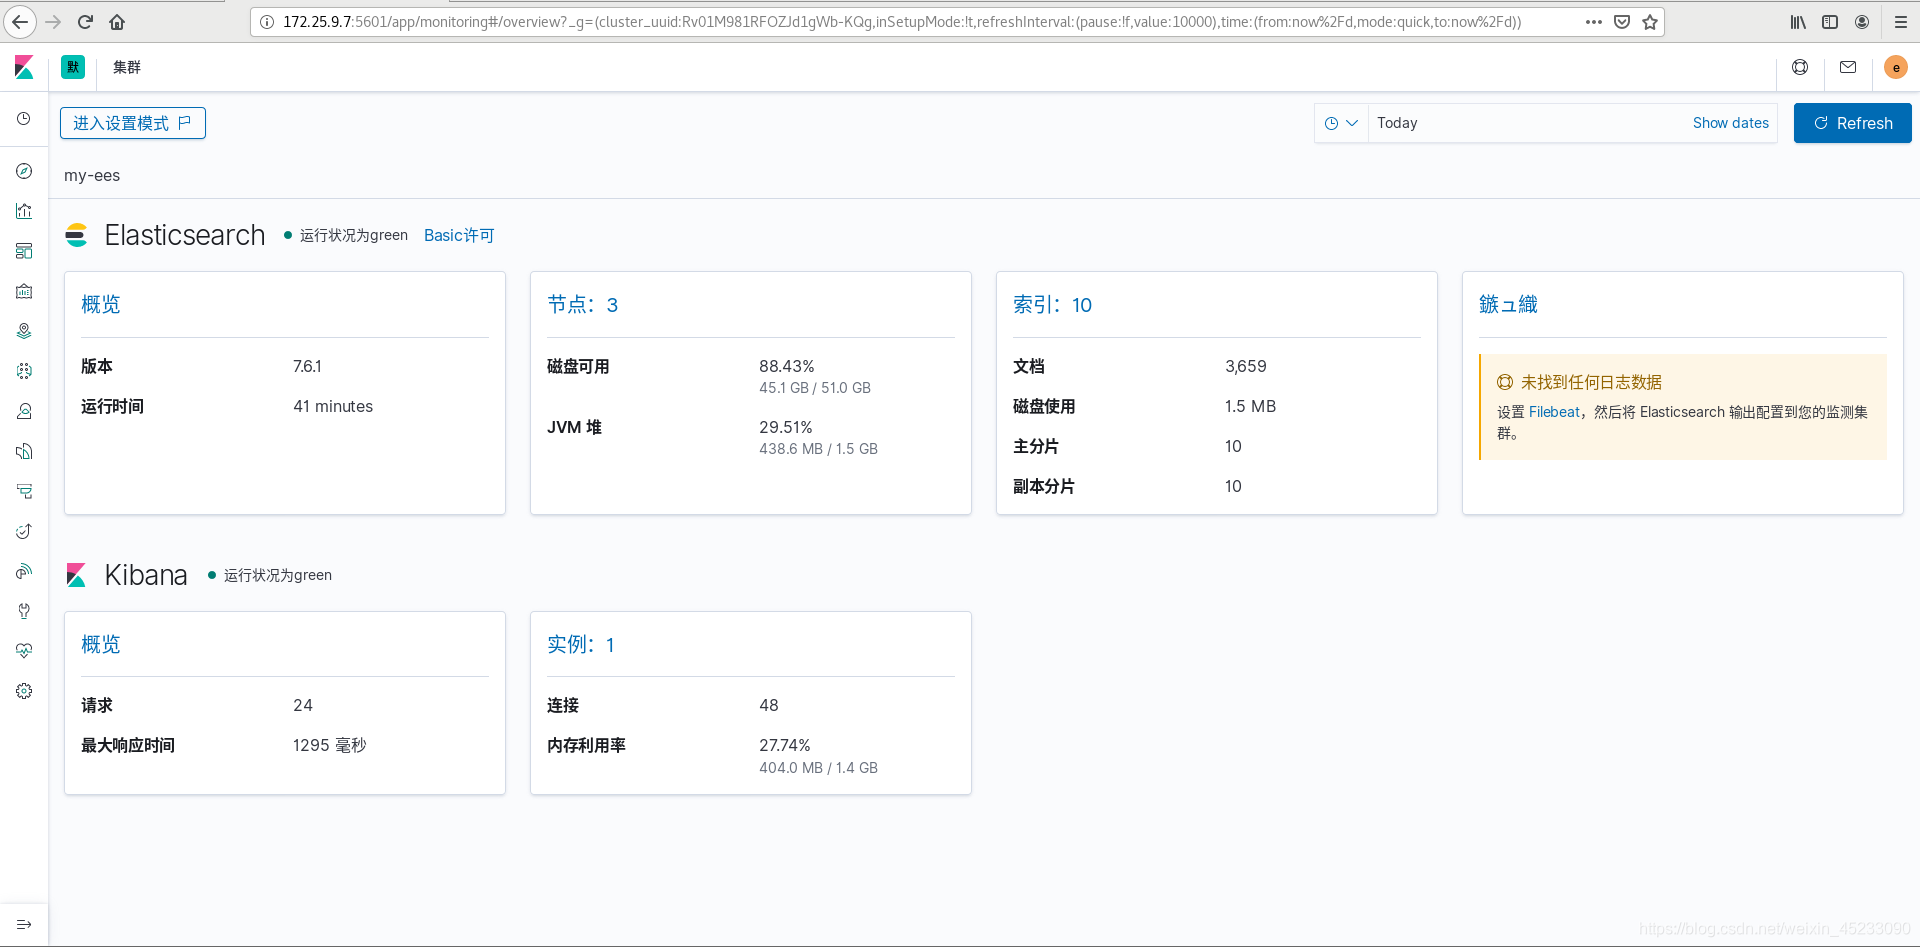
集群信息采集之插件采集
metricbeat
所有ES集群节点均需要安装metricbeat的操作
rpm -ivh metricbeat-7.6.1-x86_64.rpm
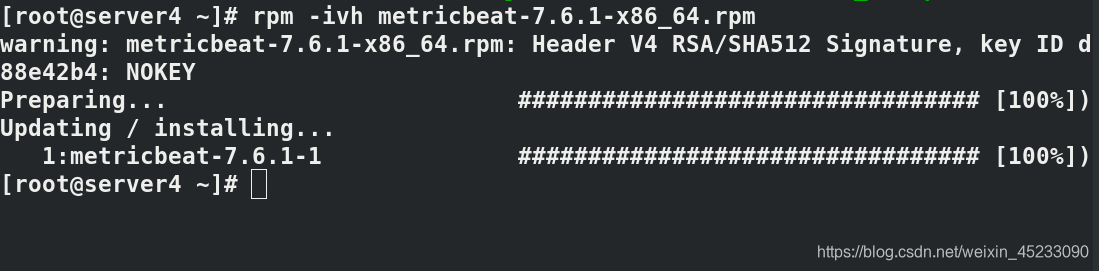
启用elasticsearch-xpack模板文件
metricbeat modules enable elasticsearch-xpack
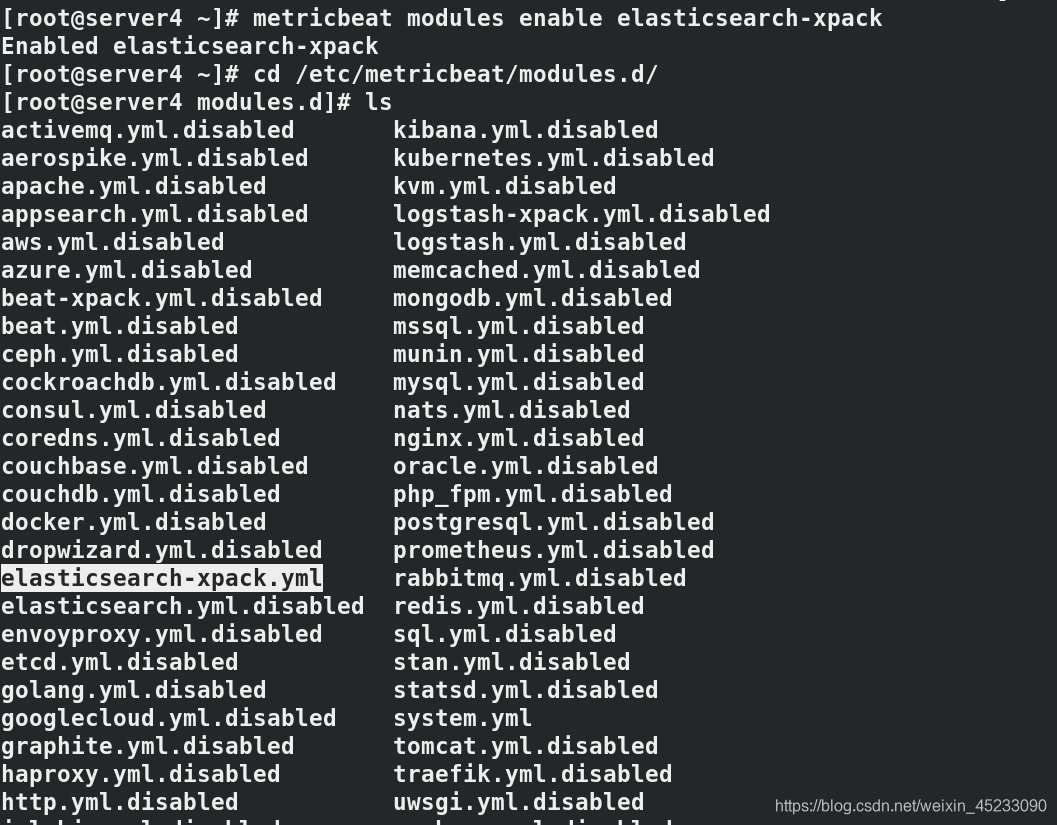
编辑模板文件
cd /etc/metricbeat/modules.d/
vim elasticsearch-xpack.yml
# Module: elasticsearch
# Docs: https://www.elastic.co/guide/en/beats/metricbeat/7.6/metricbeat-module-elasticsearch.html

- module: elasticsearch
  metricsets:
    - ccr
    - cluster_stats
    - enrich
    - index
    - index_recovery
    - index_summary
    - ml_job
    - node_stats
    - shard
  period: 10s
  hosts: ["http://localhost:9200"]
  username: "elastic"
  password: "westos"
  xpack.enabled: true
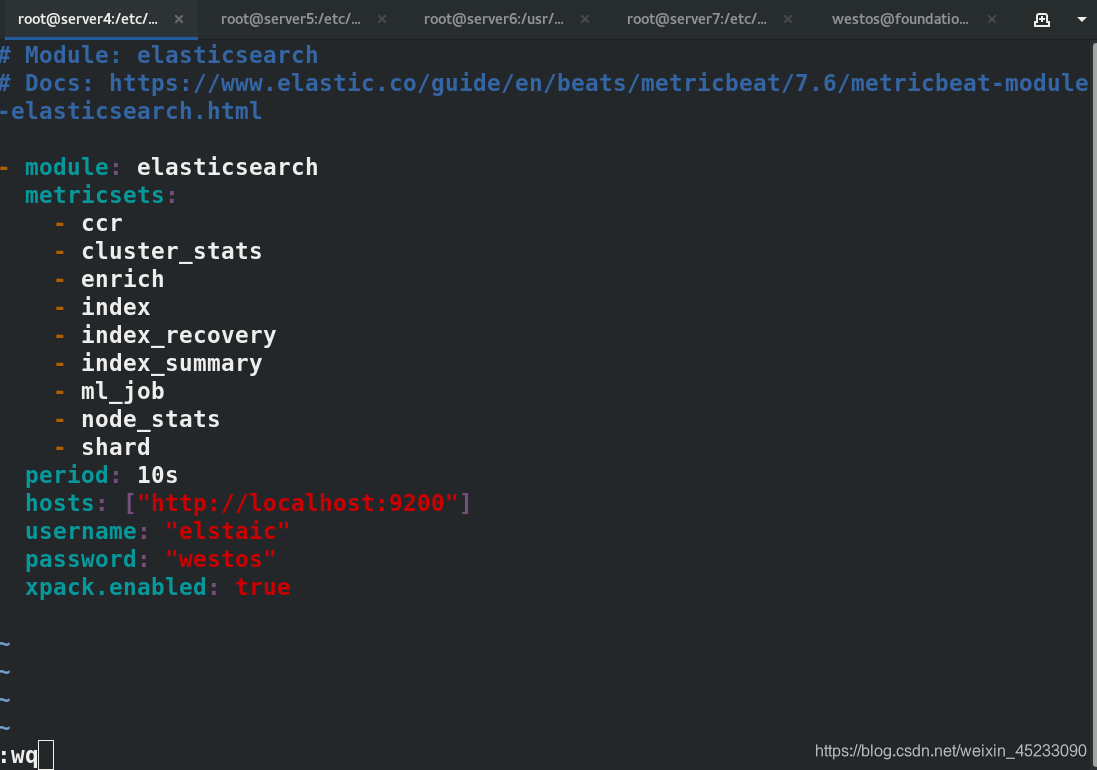
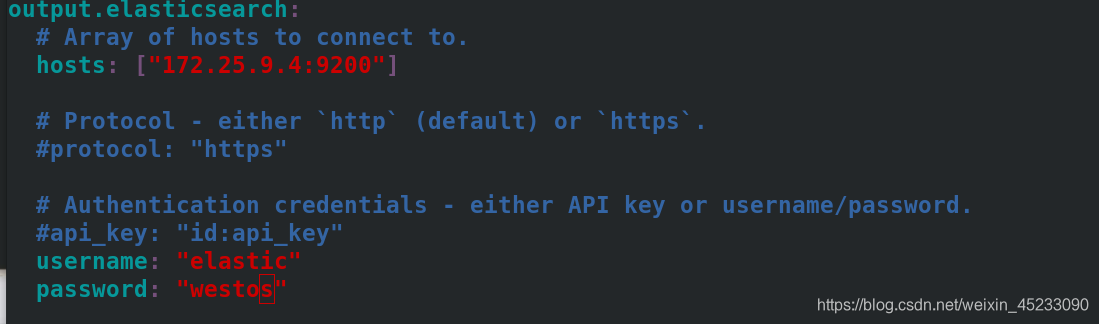
编辑metricbeat主配置文件
vim metricbeat.yml
output.elasticsearch:
  # Array of hosts to connect to.
  hosts: ["172.25.9.4:9200"]

  # Protocol - either `http` (default) or `https`.
  #protocol: "https"

  # Authentication credentials - either API key or username/password.
  #api_key: "id:api_key"
  username: "elastic"
  password: "westos"
启动metricbeat
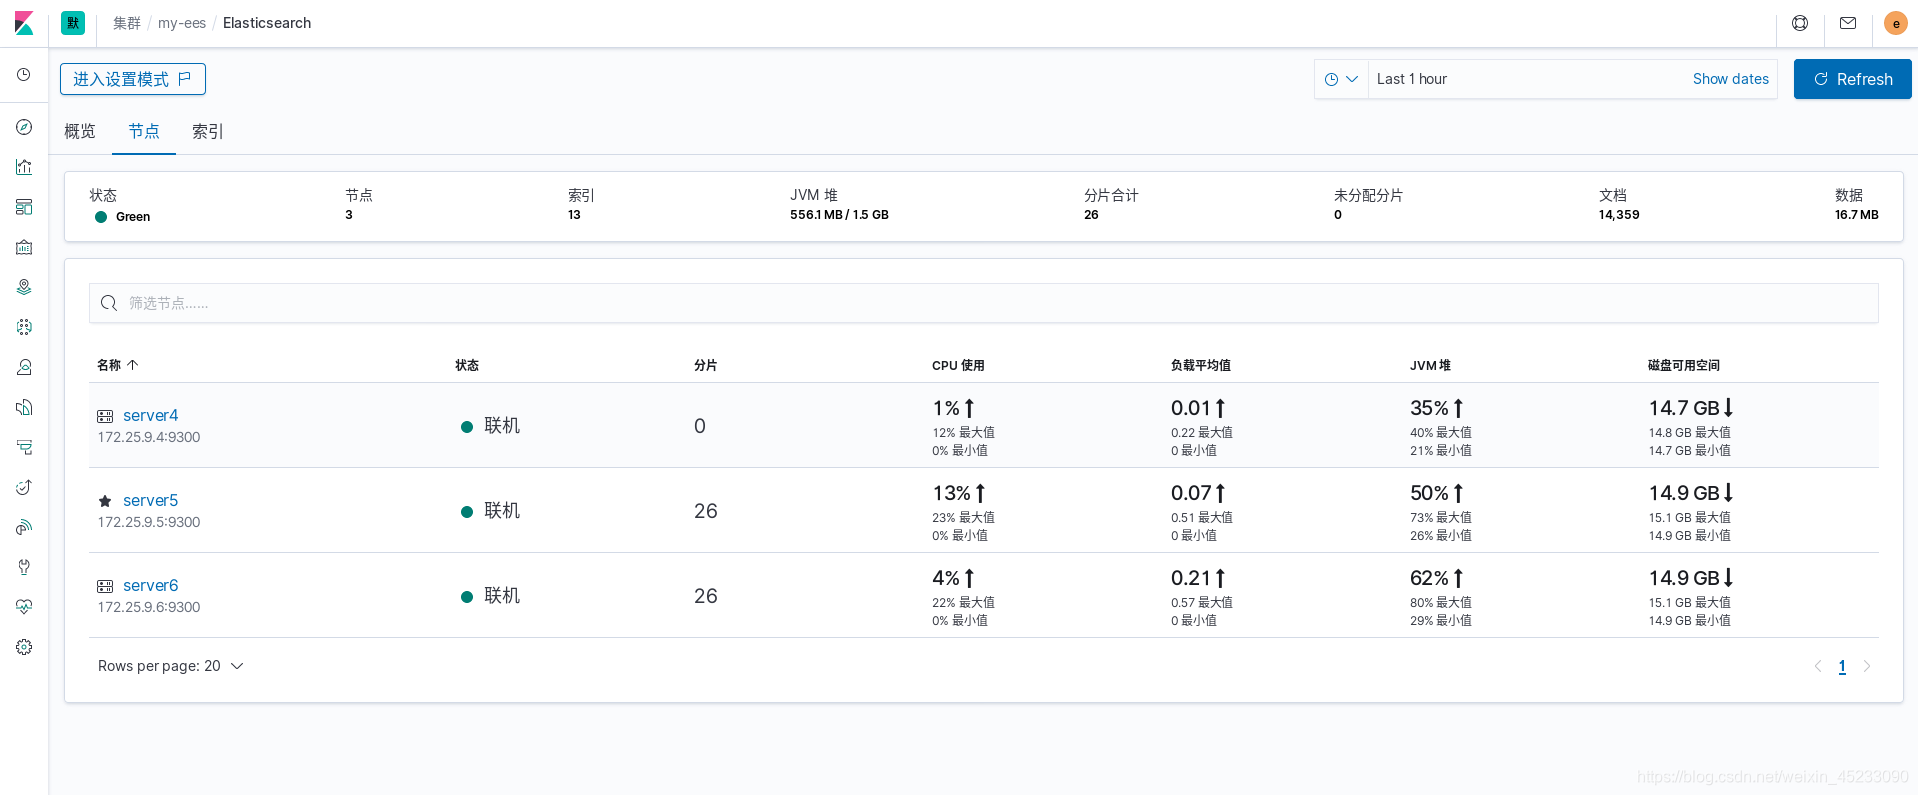
systemctl enable metricbeat.service --now

注意:所有ES集群都需要上述操作,完成后监控查看
filebeat
普通ELK架构
logstash -> es -> kibana
企业ELK架构
filebeat -> kafka/redis -> logstash -> es -> kibana
在这里还用到消息队列redis/kafka作为缓存使用。通过logstash搜集日志数据存入redis/kafka,再通过logstash对数据格式转化处理后储存到Elasticsearch中。
所有ES集群节点均需要安装filebeat的操作
参考文档:
https://www.elastic.co/guide/en/beats/filebeat/7.6/filebeat-module-elasticsearch.html
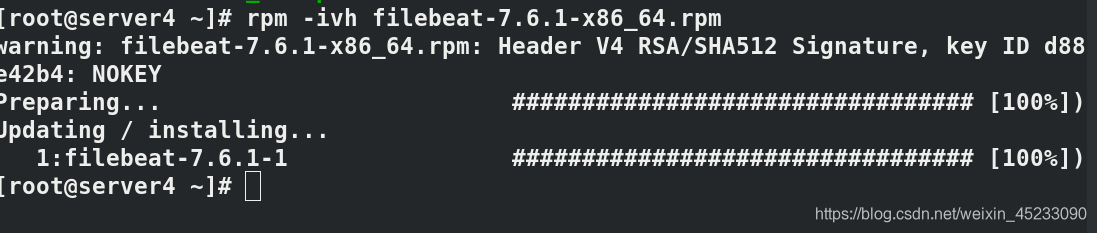
安装rpm包
rpm -ivh filebeat-7.6.1-x86_64.rpm
filebeat modules enable elasticsearch
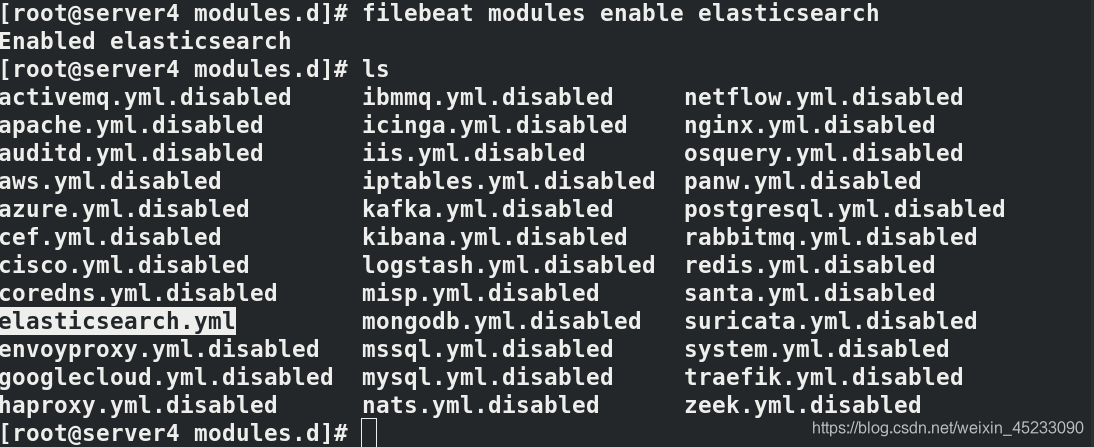
编辑模板文件
cd /etc/filebeat/modules.d/
vim elasticsearch.yml
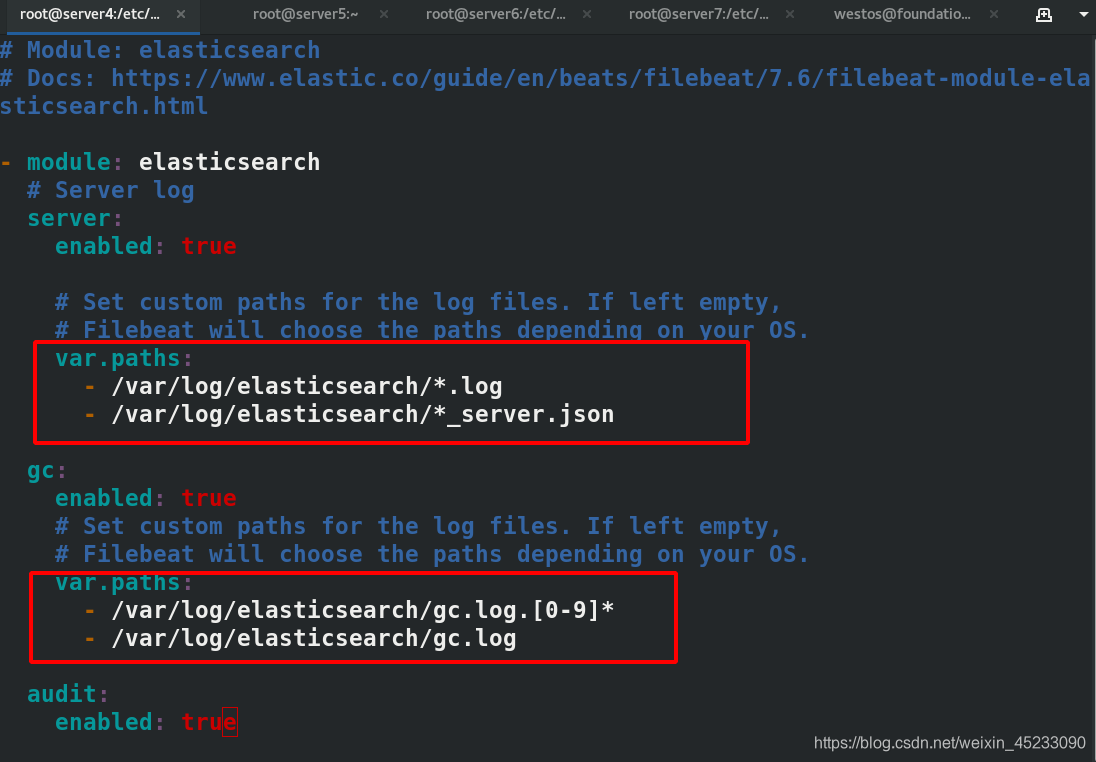
# Module: elasticsearch
# Docs: https://www.elastic.co/guide/en/beats/filebeat/7.6/filebeat-module-elasticsearch.html

- module: elasticsearch
  # Server log
  server:
    enabled: true

    # Set custom paths for the log files. If left empty,
    # Filebeat will choose the paths depending on your OS.
    var.paths:
      - /var/log/elasticsearch/*.log
      - /var/log/elasticsearch/*_server.json

  gc:
    enabled: true
    # Set custom paths for the log files. If left empty,
    # Filebeat will choose the paths depending on your OS.
    var.paths:
      - /var/log/elasticsearch/gc.log.[0-9]*
      - /var/log/elasticsearch/gc.log

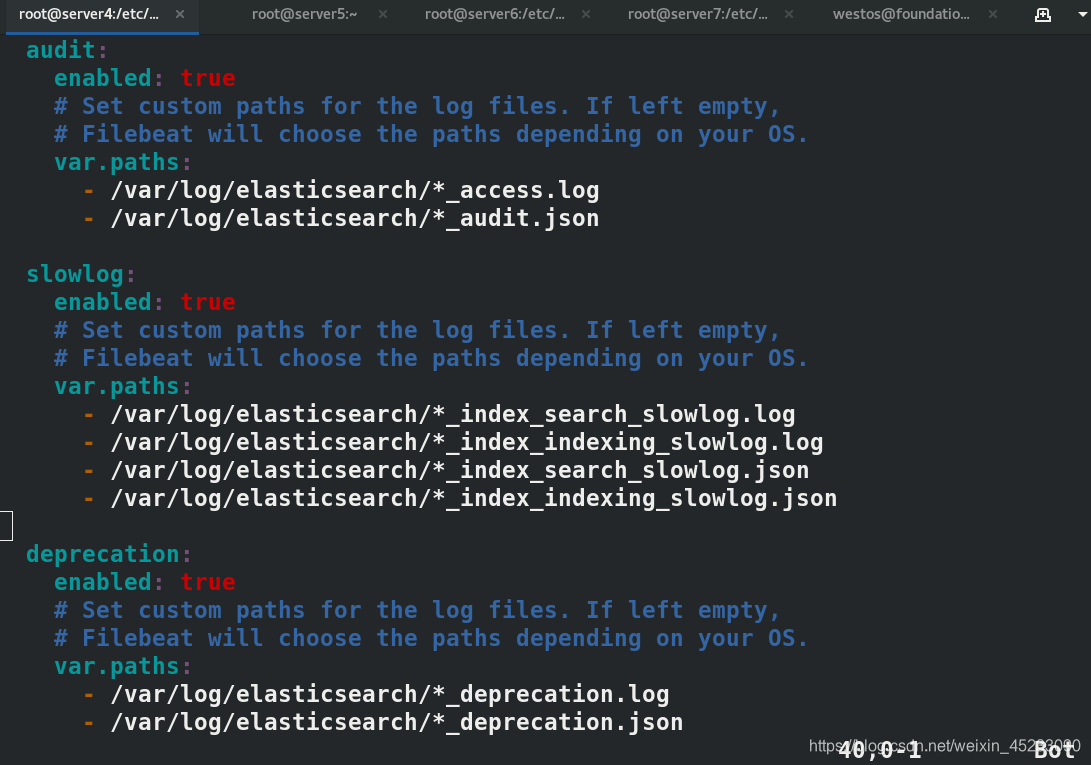
  audit:
    enabled: true
    # Set custom paths for the log files. If left empty,
    # Filebeat will choose the paths depending on your OS.
    var.paths:
      - /var/log/elasticsearch/*_access.log
      - /var/log/elasticsearch/*_audit.json

  slowlog:
    enabled: true
    # Set custom paths for the log files. If left empty,
    # Filebeat will choose the paths depending on your OS.
    var.paths:
      - /var/log/elasticsearch/*_index_search_slowlog.log
      - /var/log/elasticsearch/*_index_indexing_slowlog.log
      - /var/log/elasticsearch/*_index_search_slowlog.json
      - /var/log/elasticsearch/*_index_indexing_slowlog.json

  deprecation:
    enabled: true
    # Set custom paths for the log files. If left empty,
    # Filebeat will choose the paths depending on your OS.
    var.paths:
      - /var/log/elasticsearch/*_deprecation.log
      - /var/log/elasticsearch/*_deprecation.json
编辑filebeat主配文件
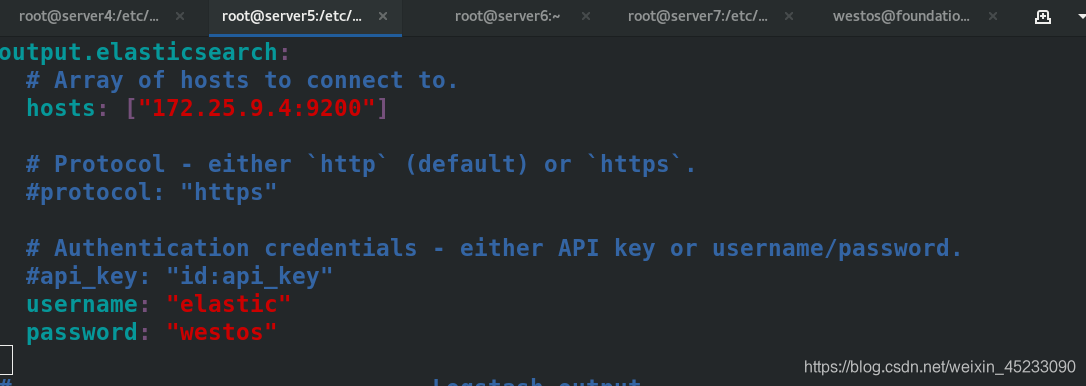
vim filebeat.yml
output.elasticsearch:
  # Array of hosts to connect to.
  hosts: ["172.25.9.4:9200"]

  # Protocol - either `http` (default) or `https`.
  #protocol: "https"

  # Authentication credentials - either API key or username/password.
  #api_key: "id:api_key"
  username: "elastic"
  password: "westos"
systemctl enable --now filebeat.service

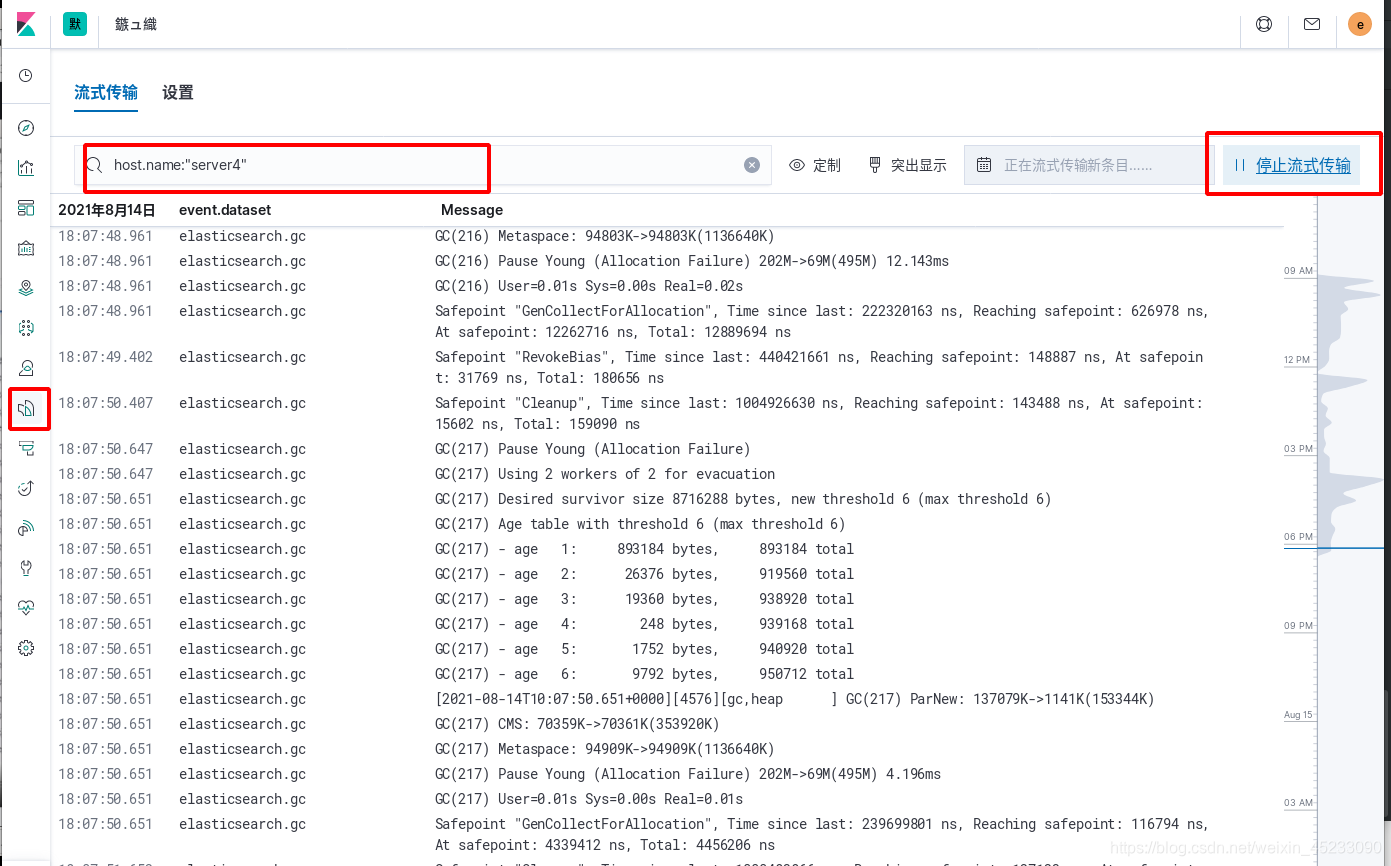
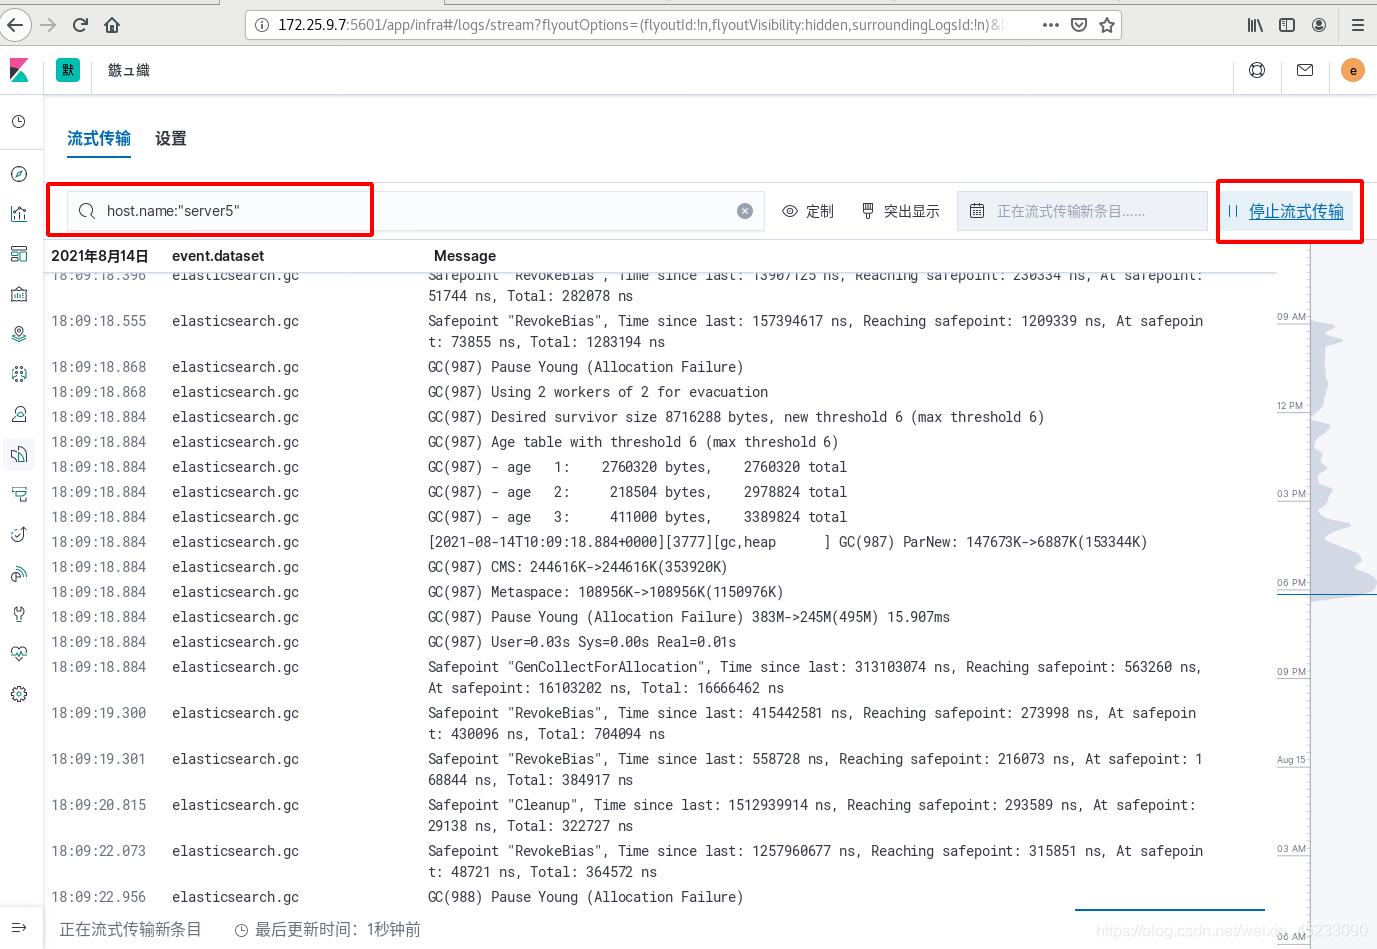
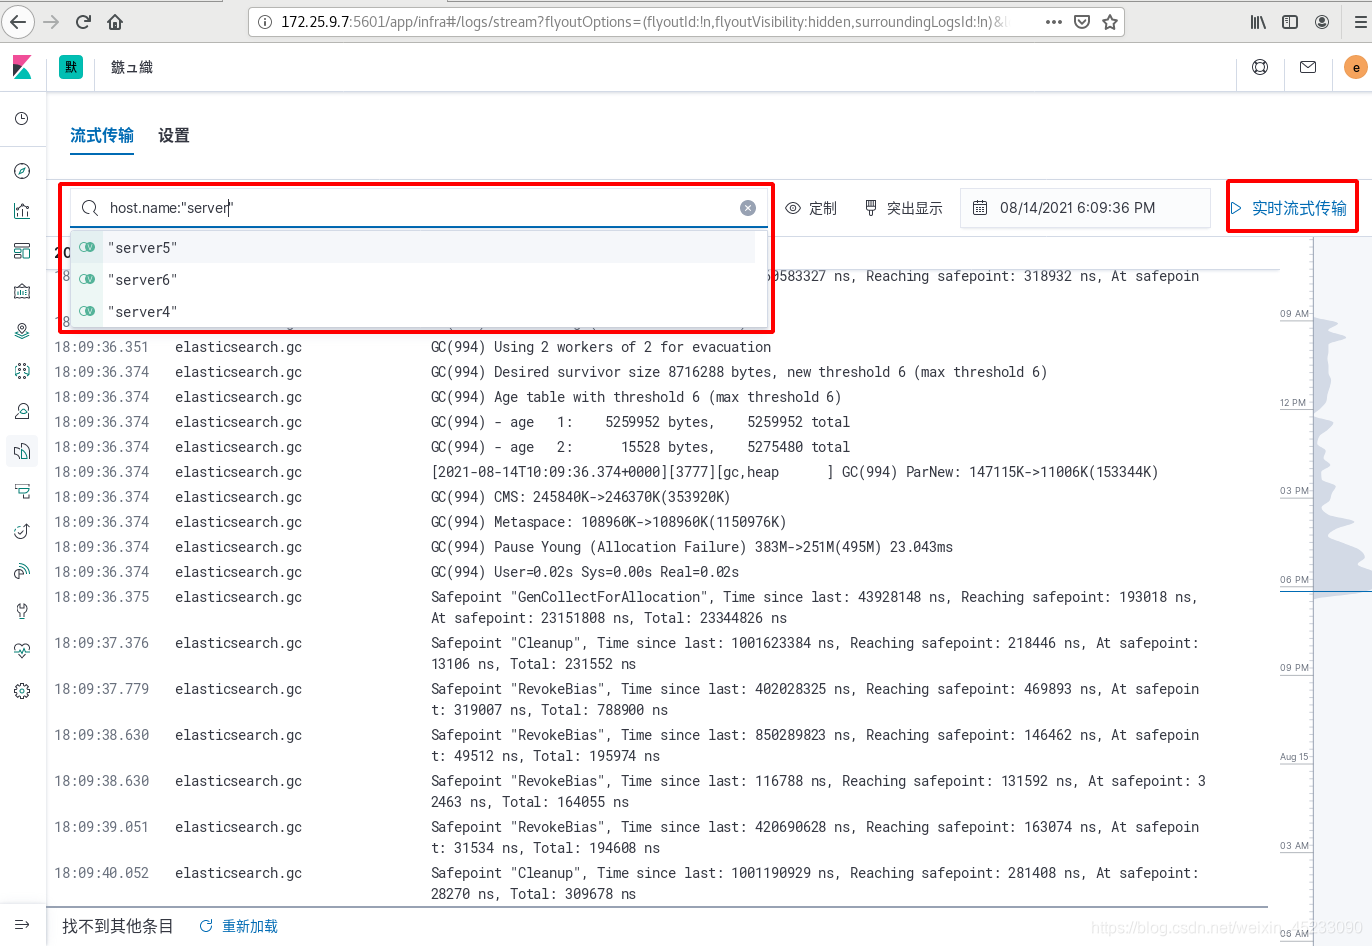
可视化UI查看日志数据
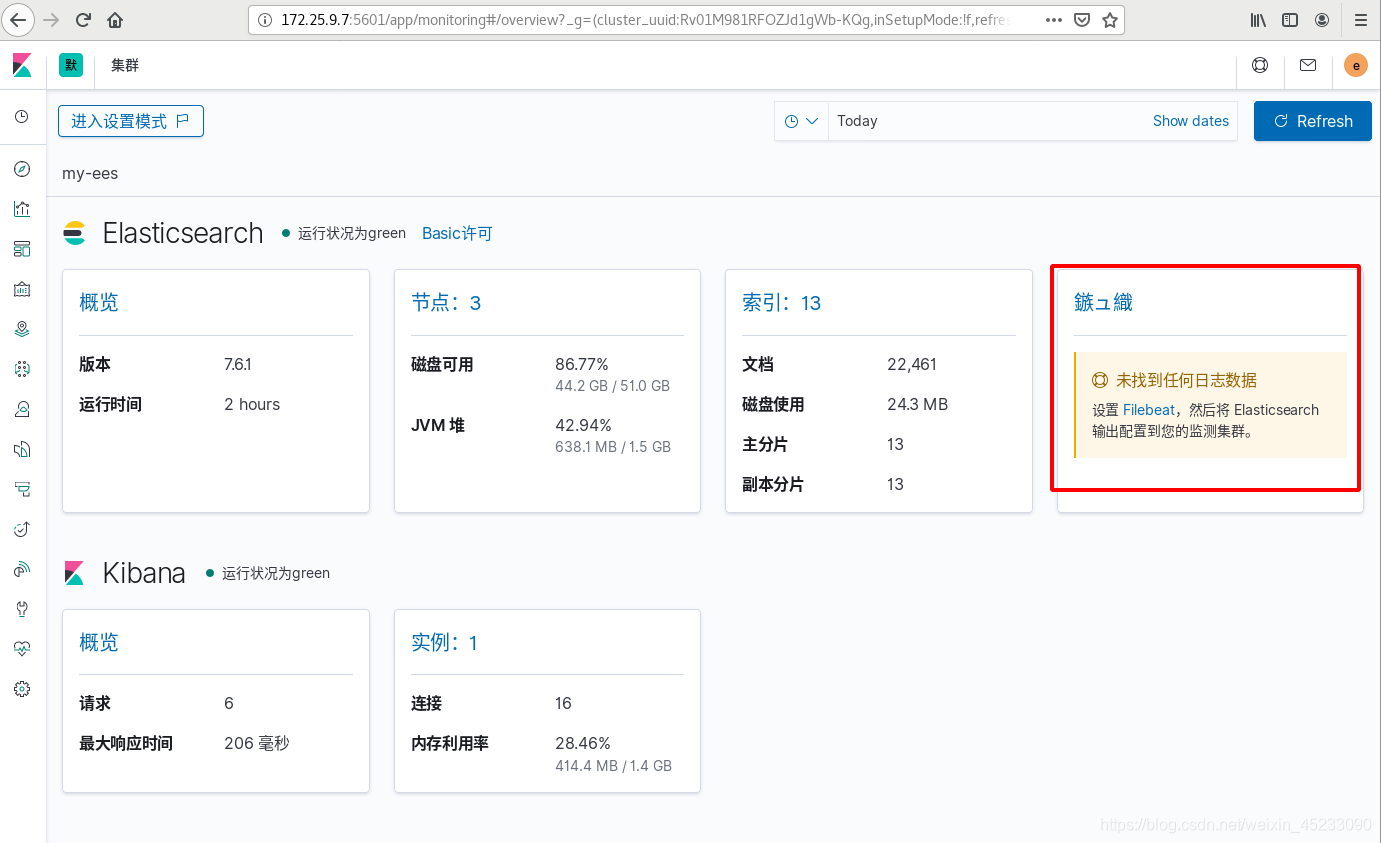
可以通过流式传输关键字数据

北京人形旗下天工造物具身智能开源社区,聚焦具身天工与慧思开物两大平台
更多推荐
 0
0 0
0- 0


 已为社区贡献4条内容

所有评论(0)