pandas与scipy常见功能及实例可视化
·
在本次练习中,我们将分析BRFSS的重量与身高数据。从课程网站下载数据和代码骨架。代码骨架包含加载数据并生成数字数组件的代码。数字阵列中的五个列表示:年龄、current_weight(公斤)、weight_a_year_ago(公斤)、身高(厘米)和性别,其中性别 =1 代表男性,2 代表女性。
1. 使用HW1 的代码生成关于current_weight、weight_a_year_ago和高度的汇总统计图。
代码:
import pandas as pd
import matplotlib.pyplot as plt
data = pd.read_csv("brfss.csv")
data.fillna(data.mean(),inplace=True)
data1=data[['weight2','wtyrago','htm3']]
sta=data1.describe()
print(sta)
plt.scatter(sta.loc['max'].index,sta.loc['max'],color='k',marker='v')
plt.scatter(sta.loc['min'].index,sta.loc['min'],color='k',marker='^')
plt.scatter(sta.loc['mean'].index,sta.loc['mean'],color='b',marker='+')
plt.scatter(sta.loc['50%'].index,sta.loc['50%'],color='b',marker='x')
plt.scatter(sta.loc['75%'].index,sta.loc['75%'],color='r',marker='v')
plt.scatter(sta.loc['25%'].index,sta.loc['25%'],color='r',marker='^')
plt.xticks([i for i in range(4)])
plt.legend(['max','min','mean','median','75%','25%'])
plt.show()
运行截图:
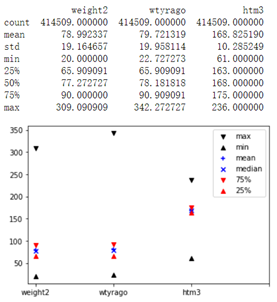
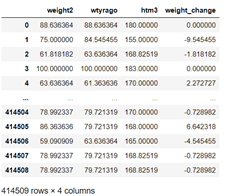
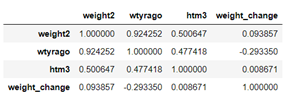
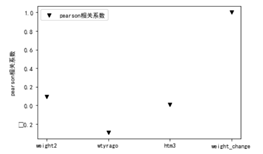
2.定义weight_change=(current_weight=weight_a_year_ago)。计算weight_change和以下变量之间的相关性,并确定哪一个与weight_change关联度最相关(无论相关性迹象如何)。使用分散图来支持您的结论。(1)current_weight(2)weight_a_year_ago(3)年龄
代码:
data1.loc[:,'weight_change']=data1['weight2']-data1['wtyrago']
data1

cor = data1.corr()
cor

plt.scatter(cor.loc['weight_change'].index,cor.loc['weight_change'],color='k',marker='v')
plt.rcParams['font.sans-serif']=['SimHei']   # 用黑体显示中文
plt.xticks([i for i in range(4)])
plt.ylabel('pearson相关系数')
plt.legend(['pearson相关系数'])
plt.show()
运行截图:
3.计算和比较男女weight_change的平均值和SEM(平均标准误差)。使用 t 测试来测试男性和女性的weight_change之间是否存在显著差异
代码:
data.loc[:,'weight_change']=data['weight2']-data['wtyrago']
data

male_data=data[data['sex']==1]
female_data=data[data['sex']==2]
print("体重变化均值:")
print('男:',round(male_data['weight_change'].mean(),2),'女:',round(female_data['weight_change'].mean(),2))
print("体重变化标准差:")
print('男:',round(male_data['weight_change'].std(),2),'女:',round(female_data['weight_change'].std(),2))

from scipy import stats
r=stats.ttest_ind(male_data['weight_change'],female_data['weight_change'])
print("statistic:", r.__getattribute__("statistic"))
print("pvalue:", r.__getattribute__("pvalue"))
运行截图:
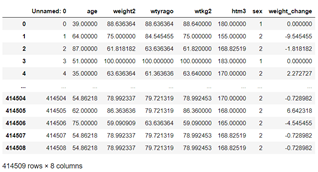
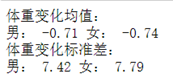
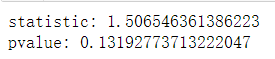
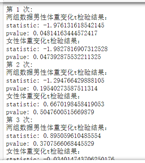
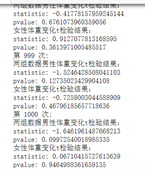
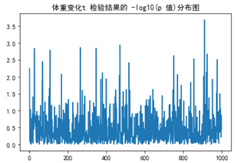
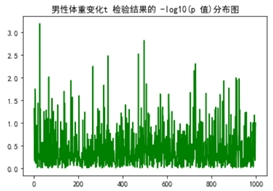
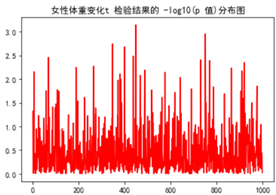
4.随机将受试者分成两组大小大致相等的受试者,并使用 t 测试来测试两组的weight_change之间是否存在显著差异。重复该过程 1000 次,并绘制 t 测试结果的 -log10(p 值)的分布图。关于男女在weight_change方面的区别,你能说什么?
代码:
from scipy import stats
import numpy as np
pvalue4=[]
male_p4=[]
female_p4=[]
for i in range(1000):
    shuffled = data.sample(frac=1)
    data4=np.array_split(shuffled, 2)
    r4=stats.ttest_ind(data4[0]['weight_change'],data4[1]['weight_change'])
    pvalue4.append(r4.__getattribute__("pvalue"))
    r4_male=stats.ttest_ind(data4[0][data4[0]['sex']==1]['weight_change'],data4[1][data4[1]['sex']==1]['weight_change'])
r4_female=stats.ttest_ind(data4[0][data4[0]['sex']==2]['weight_change'],data4[1][data4[1]['sex']==2]['weight_change'])
    print('第',i+1,'次:')
    print('两组数据男性体重变化t检验结果:')
    print("statistic:", r4_male.__getattribute__("statistic"))
    print("pvalue:", r4_male.__getattribute__("pvalue"))
    male_p4.append(r4_male.__getattribute__("pvalue"))
    print('女性体重变化t检验结果:')
    print("statistic:", r4_female.__getattribute__("statistic"))
    print("pvalue:", r4_female.__getattribute__("pvalue"))
    female_p4.append(r4_female.__getattribute__("pvalue"))
print(pvalue4)
print(male_p4)
print(female_p4)
plt.rcParams['font.sans-serif']=['SimHei']   # 用黑体显示中文
plt.plot([x for x in range(len(pvalue))],list(map(lambda x: -math.log10(x),pvalue)))
plt.title('体重变化t 检验结果的 -log10(p 值)分布图')
plt.show()
plt.plot([x for x in range(len(pvalue4))],list(map(lambda x: -math.log10(x),male_p4)),color='g')
plt.title('男性体重变化t 检验结果的 -log10(p 值)分布图')
plt.show()

plt.plot([x for x in range(len(pvalue4))],list(map(lambda x: -math.log10(x),female_p4)),color='r')
plt.title('女性体重变化t 检验结果的 -log10(p 值)分布图')
plt.show()
运行截图:
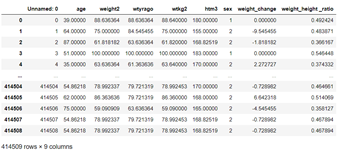
5.将weight_height _ratio定义为current_weight/高度。使用 t 测试来测试男性和女性的weight_height_ratio之间是否存在显著差异。此外,重复您在4d中所做的分析,但在分析中用weight_height_ratio替换weight_change。
代码:
data.loc[:,'weight_height _ratio']=data['weight2']/data['htm3']
data

male_weight_height_ratio=data[data['sex']==1]['weight_height_ratio']
female_weight_height_ratio=data[data['sex']==2]['weight_height_ratio']
from scipy import stats
r5=stats.ttest_ind(male_weight_height_ratio,female_weight_height_ratio)
print("statistic:", r5.__getattribute__("statistic"))
print("pvalue:", r5.__getattribute__("pvalue"))
  p<0.001,说明两组间存在显著性差异。结果很好。
重复在4d中所做的分析:
from scipy import stats
import numpy as np

pvalue5=[]
male_p5=[]
female_p5=[]
for i in range(1000):
    shuffled = data.sample(frac=1)
    data5=np.array_split(shuffled, 2)
    r5=stats.ttest_ind(data5[0]['weight_height_ratio'],data5[1]['weight_height_ratio'])
pvalue5.append(r5.__getattribute__("pvalue"))  r5_male=stats.ttest_ind(data5[0][data5[0]['sex']==1]['weight_height_ratio'],data5[1][data5[1]['sex']==1]['weight_height_ratio'])
r5_female=stats.ttest_ind(data5[0][data5[0]['sex']==2]['weight_height_ratio'],data5[1][data5[1]['sex']==2]['weight_height_ratio'])
    print('第',i+1,'次:')
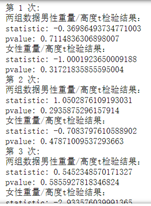
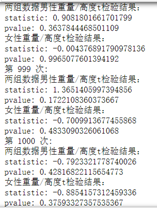
    print('两组数据男性重量/高度t检验结果:')
    print("statistic:", r5_male.__getattribute__("statistic"))
    print("pvalue:", r5_male.__getattribute__("pvalue"))
    male_p5.append(r5_male.__getattribute__("pvalue"))
    print('女性重量/高度t检验结果:')
    print("statistic:", r5_female.__getattribute__("statistic"))
    print("pvalue:", r5_female.__getattribute__("pvalue"))
    female_p5.append(r5_female.__getattribute__("pvalue"))
print(pvalue5)
print(male_p5)
print(female_p5)
import math
plt.rcParams['font.sans-serif']=['SimHei']   # 用黑体显示中文
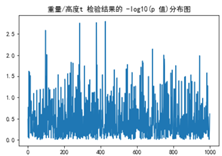
plt.plot([x for x in range(len(pvalue5))],list(map(lambda x: -math.log10(x),pvalue5)))
plt.title('重量/高度t 检验结果的 -log10(p 值)分布图')
plt.show()

plt.plot([x for x in range(len(pvalue5))],list(map(lambda x: -math.log10(x),male_p5)))
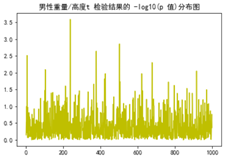
plt.title('男性重量/高度t 检验结果的 -log10(p 值)分布图')
plt.show()
plt.plot([x for x in range(len(pvalue5))],list(map(lambda x: -math.log10(x),female_p5)))
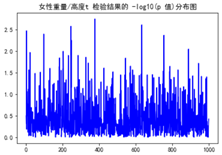
plt.title('女性重量/高度t 检验结果的 -log10(p 值)分布图')
plt.show()
运行截图:


北京人形旗下天工造物具身智能开源社区,聚焦具身天工与慧思开物两大平台
更多推荐
 0
0 0
0- 0


 已为社区贡献1条内容

所有评论(0)