【Delaunay三角网】scipy.spatial.Delaunay函数解析及其与Geopandas结合绘制Delaunay三角网
·
常用参数解析
- points: 包含x,y坐标的点,用于生成Delaunay三角网。格式:[[x1, y1], [x2, y2], [x3, y3], …]
- incremental: 是否允许继续加点,默认False
常用属性解析
-
points:即你输入的那些点

-
simplices:Delaunay函数生成的那些三角形,每个三角形用其三个顶点的顶点号表示,每个三角形的顶点号按照逆时针排列

-
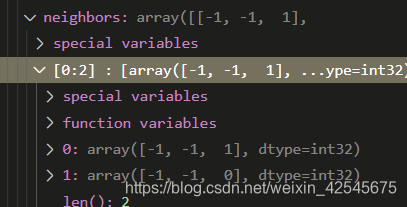
neighbors:每个三角形的邻居三角形,每个三角形至多三个邻居,第k个邻居在第k个顶点的对面(就是和第k个顶点相对,见下图),-1表示那条边没有邻居三角形:

在这张图片中黑色的数字表示顶点号,红色的数字表示三角形号,对于0号三角形假设它的顶点号组成为[3, 0, 2],那么它的邻居三角形的组成为[-1, -1, 1]。第一个顶点, 即3号顶点对应的边为[0,2]是一个边界边,没有邻居多边形,所以邻居列表中第一个值为-1,同理第三个顶点号2,对应的边为[3, 0],邻居多边形为1,所以对应位置填1。具体如下:
-
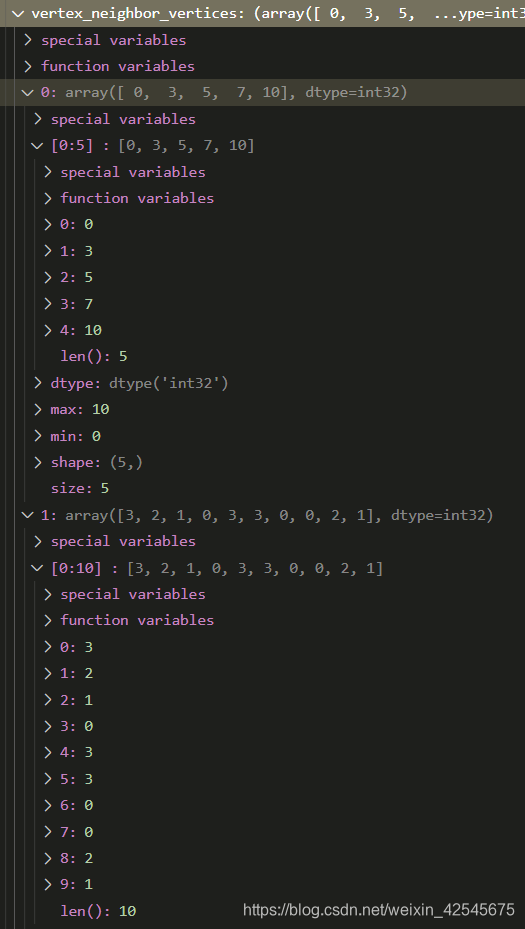
vertex_neighbor_vertices:每个顶点的所有邻居顶点号。其中包含一个元组 (indptr, indices). 第k个顶点的所有邻居顶点号按indices[indptr[k]:indptr[k+1]]获取。
-
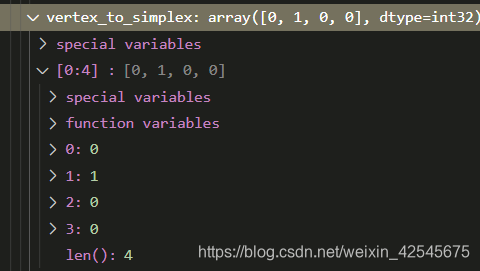
vertex_to_simplex:每个顶点所属的三角形号(1个顶点号就对应一个三角形号,如果想要其对应的全部的三角形号可以通过每个顶点的邻居顶点所对应的三角形号,取一个unique计算得到)。
-
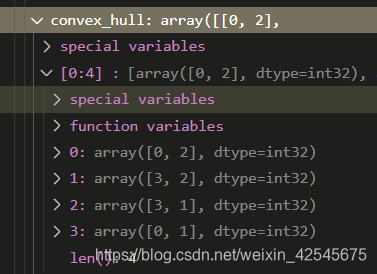
convex_hull:三角网的凸包,即最外层边界,集合是一组边
结合geopandas绘制Delaunay三角网
import geopandas as gpd
import matplotlib.pyplot as plt
from scipy.spatial import Delaunay
import numpy as np

city_pts_path = r"test_Points.shp" # 改为你自己的路径
pts_gdf = gpd.read_file(city_pts_path)
pts_geo = pts_gdf['geometry']
pt_coords = pts_geo.apply(lambda p: [p.x, p.y])
pt_coords = np.array(pt_coords.tolist())
tri = Delaunay(pt_coords)
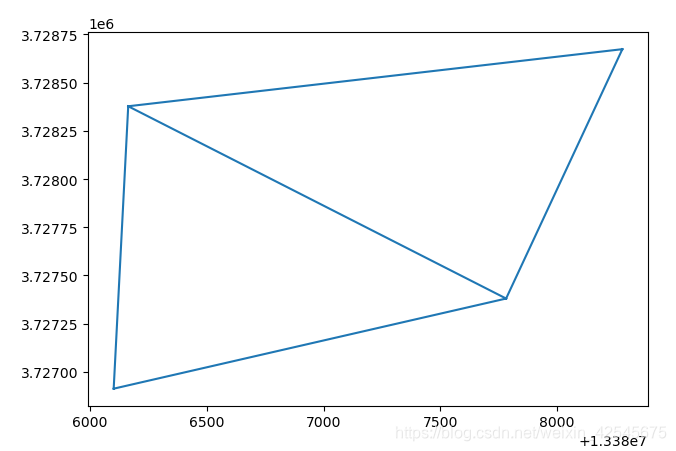
plt.triplot(pt_coords[:,0], pt_coords[:,1], tri.simplices)
plt.show()
参考资料及更多应用案例
- https://docs.scipy.org/doc/scipy/reference/generated/scipy.spatial.Delaunay.html
- https://docs.scipy.org/doc/scipy/reference/tutorial/spatial.html
如果你认为对你有用,或者想要与我有更多交流,关注我的微信公众号支持我一下吧!~


北京人形旗下天工造物具身智能开源社区,聚焦具身天工与慧思开物两大平台
更多推荐
 5
5 0
0- 0


 已为社区贡献6条内容

所有评论(0)