使用logstash分析nginx日志 elasticsearch存储日志 kibana展示日志
·
1 配置nginx
log_format  main  '$remote_addr [$time_local] "$request" $status $body_bytes_sent "$http_referer" $request_time "$upstream_addr" $upstream_response_time "$http_user_agent" "$http_x_forwarded_for"';
access_log  /var/log/nginx/access.log  main;
配置完成后,启动nginx
# nginx
2 配置logstash
新建一个nginx.conf,内容如下
input {
          file {
                   path => ["/var/log/nginx/access.log"]
                   type => "access"
                   start_position => "beginning"
                         }
}
filter {
    if [type] == "access" {
          grok {
                   match => { "message" => "^%{IPV4:remote_addr} \[%{HTTPDATE:timestamp}\] \"%{WORD:verb} %{DATA:request} HTTP/%{NUMBER:httpversion}\" %{INT:status} %{INT:body_bytes_sent} \"%{NOTSPACE:http_referer}\" %{NUMBER:request_time} \"%{DATA:http_user_agent}\" \"%{NOTSPACE:http_x_forwarded_for}\"" }
                          }
          geoip {
                   source => "remote_addr"
                 }
                            }
}
output {
          stdout { codec => rubydebug }
          elasticsearch {
                    hosts => "192.168.122.8:9200"
                           }
}
启动logstash
# ./bin/logstash -f nginx.conf
3 启动es、kibana
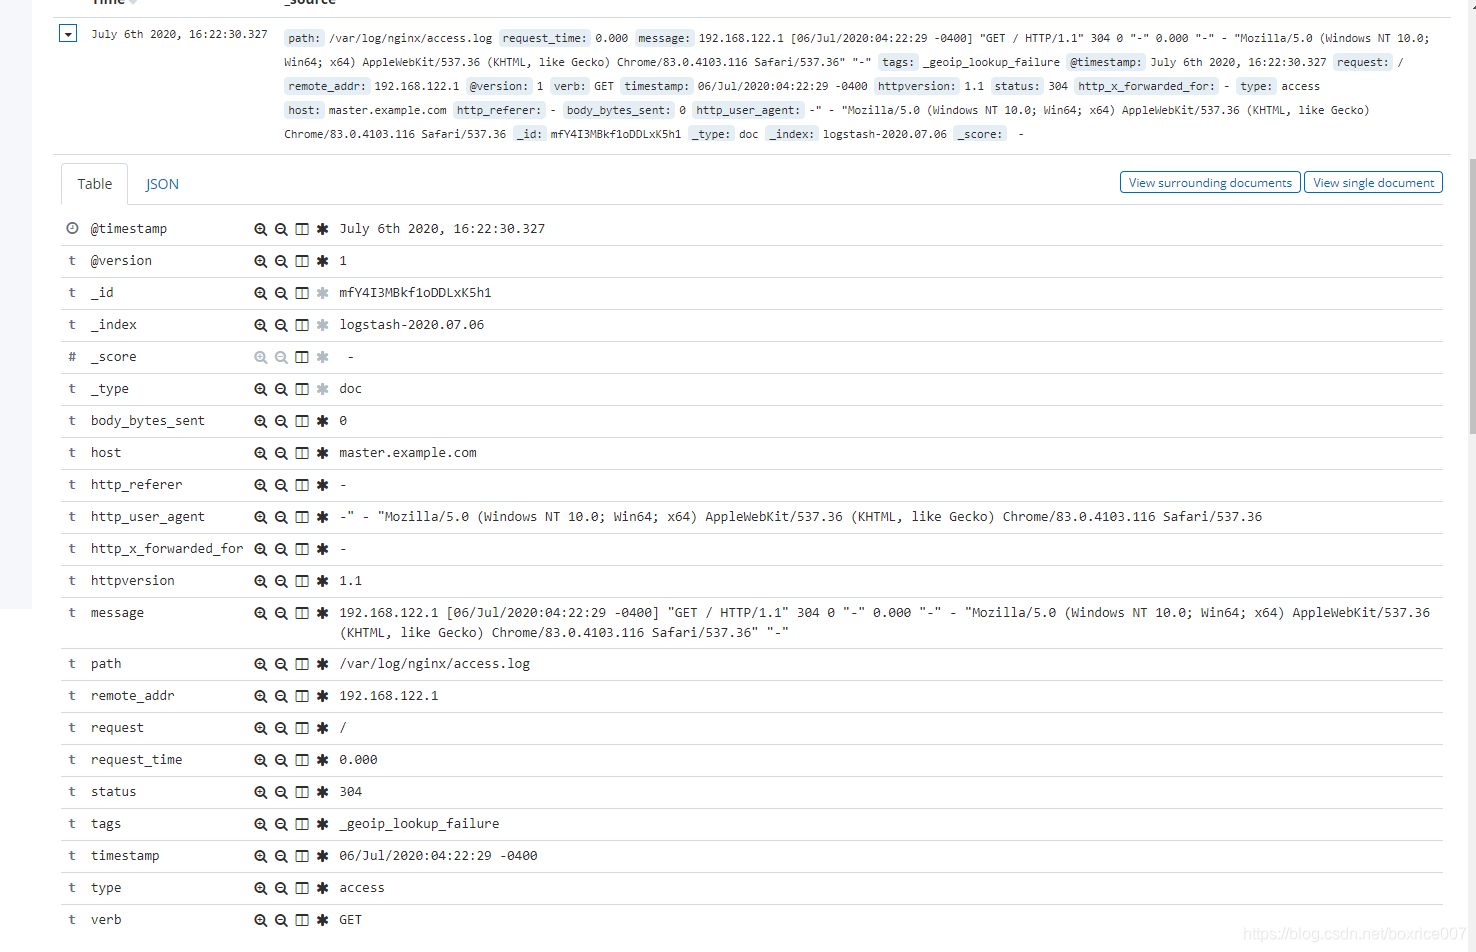
4 查看kibana页面

北京人形旗下天工造物具身智能开源社区,聚焦具身天工与慧思开物两大平台
更多推荐
 0
0 0
0- 0


 已为社区贡献2条内容

所有评论(0)