linux安装普罗米修斯监控(prometheus)
·
1、说明和注意事项
1.1、安装说明
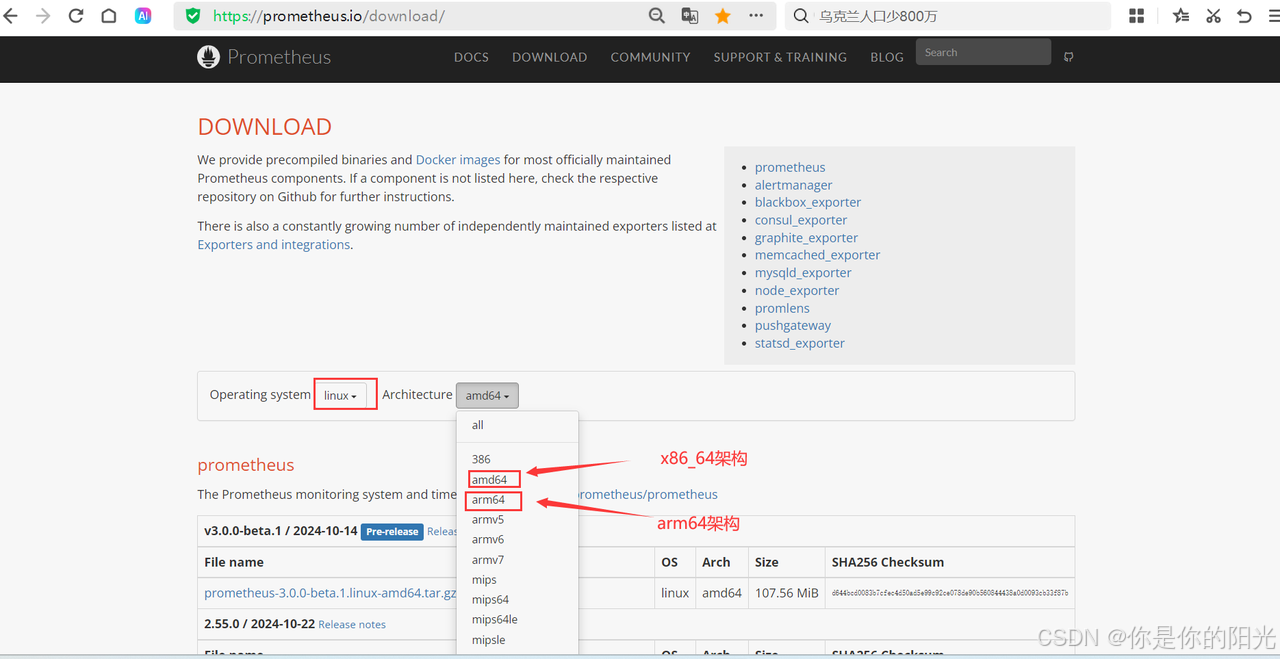
- 本次在linux的x86_64架构的服务器上搭建。所用的包也是x86_64得。如果是其它架构,请下载对应架构的包。注意:x86_86的架构,下载amd64的就可以。
- 本次安装的普罗米修斯组件格式为tar.gz格式,启动方式为nohup启动。该方式的好处是能指定位置,好管理。
- 本次安装的普罗米修斯组件有:prometheus、node_exporter、mysqld_exporter、grafana-enterprise。
- prometheus组件作为监控信息收集节点,只需要在一台服务器上部署就行。
- node_exporter组件为监控信息采集节点,需要在被监控的服务器上部署,也就是需要多台服务器部署,每台服务器上部署一个node_exporter采集节点,包括在部署prometheus组件的服务器上也需要部署,因为它本身也是一台服务器,也需要监控。
- mysqld_exporter组件为mysql数据库信息采集节点,需要配置用户密码 ,组件只需要部署在和prometheus相同的服务器上就行。需注意:该组件无需在mysql服务器上部署。
- grafana-enterprise是一个单独的监控信息可视化展示工具。借助grafana-enterprise可以动态的展示各服务器的监控情况。
2、组件下载地址
普罗米修斯及其组件下载地址:https://prometheus.io/download/
grafana可视化工具下载地址:https://grafana.com/grafana/download
grafana可视化工具的展示模板下载地址:https://grafana.com/grafana/dashboards/
3、部署规划
4、安装包准备
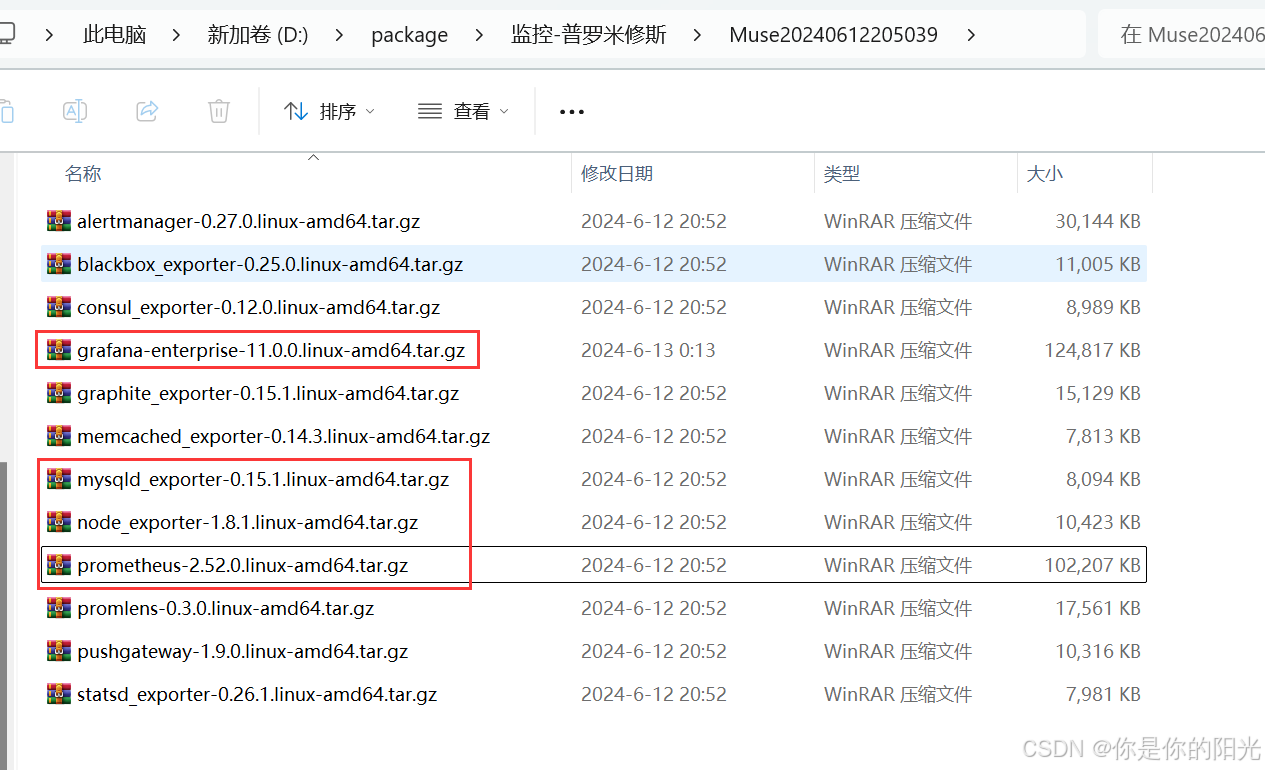
- prometheus-2.52.0.linux-amd64.tar.gz
- node_exporter-1.8.1.linux-amd64.tar.gz
- mysqld_exporter-0.15.1.linux-amd64.tar.gz
- grafana-enterprise-11.0.0.linux-amd64.tar.gz
5、安装采集组件node_exporter
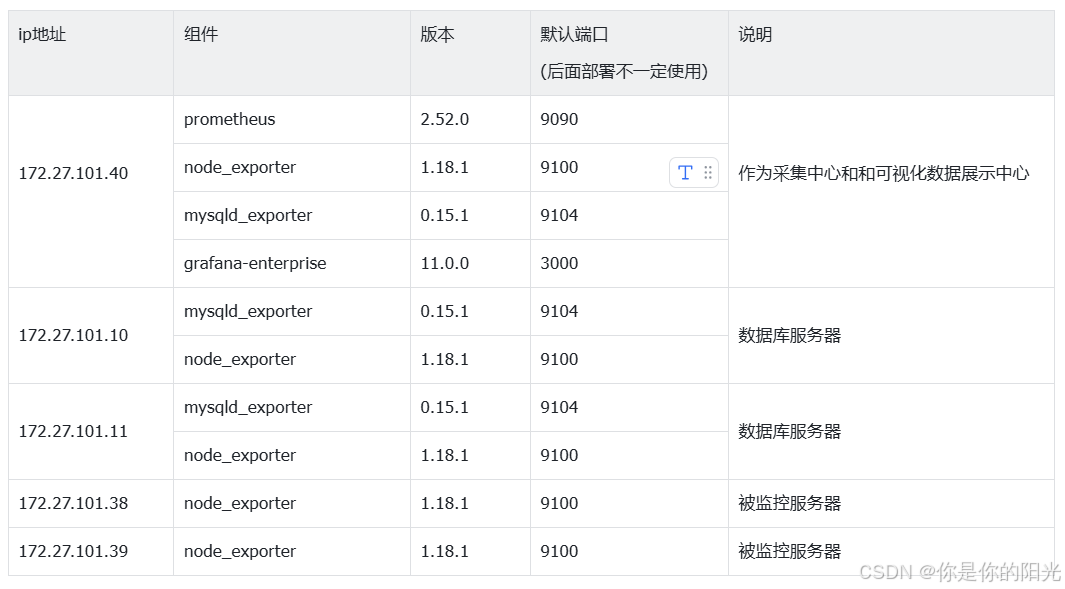
根据上面的部署规划安装,规划中共涉及到5台服务器需要安装监控采集节点node_exporter。也就是说以下操作在每台服务器上都执行。
172.27.101.40、172.27.101.10、172.17.101.11、172.27.101.38、172.27.101.39
# 创建监控文件夹
mkdir /data/jiankong

# 进入到监控文件夹里面
cd /data/jiankong

# 上传node_exporter组件
rz

# 解压
tar -zxvf node_exporter-1.8.1.linux-amd64.tar.gz

# 改名
mv node_exporter-1.8.1.linux-amd64 node_exporter

# 进入
cd node_exporter

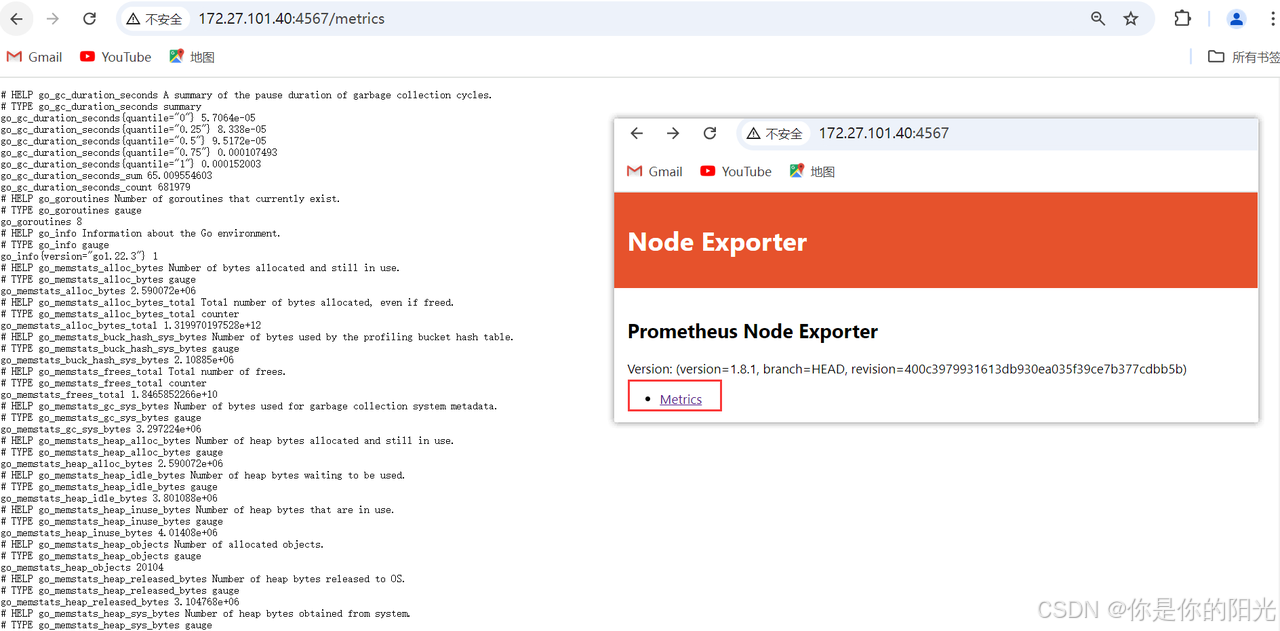
# 启动。 node_exporter默认端口为9100。如果端口不冲突可不改端口
# 这里使用--web.listen-address参数将端口改为新的4567端口。
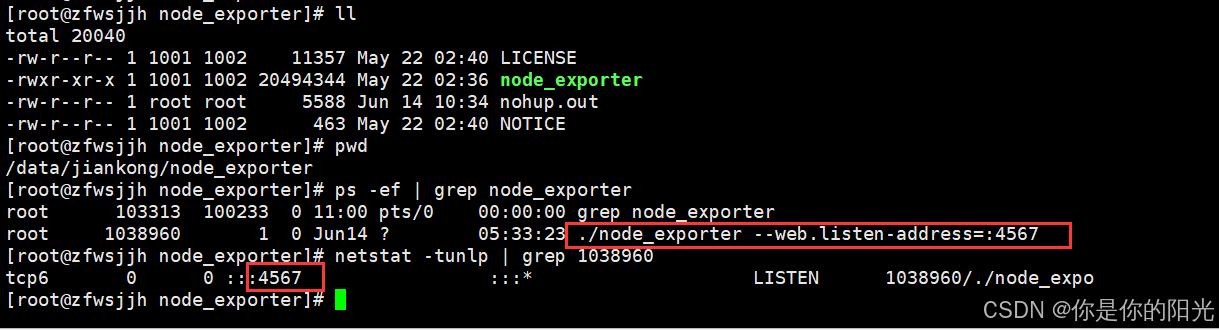
nohup ./node_exporter --web.listen-address=:4567 > ./nohup.out 2>&1 &
#nohup ./node_exporter > ./nohup.out 2>&1 &    # 默认端口启动

# 验证进程和端口
ps -ef | grep node_exporter
netstat -tunlp | grep 4567

# 排错
# 如果程序没启来,查看nohup.out日志排查。

# 浏览器访问 ip:4567
6、安装收集中心组件prometheus
收集中心节点prometheus只需要在其中的一台服务器上安装即可。根据部署规划,我们定义prometheus组件只需要在172.27.101.40服务器上安装。
# 创建监控文件夹
mkdir /data/jiankong

# 进入到监控文件夹里面
cd /data/jiankong

# 上传prometheus组件
rz

# 解压
tar -zxvf prometheus-2.52.0.linux-amd64.tar.gz

# 改名
mv prometheus-2.52.0.linux-amd64 prometheus

# 进入
cd prometheus

# 备份prometheus.yml文件
cp prometheus.yml prometheus-bak.yml

# 编辑prometheus.yml文件
vim prometheus.yml


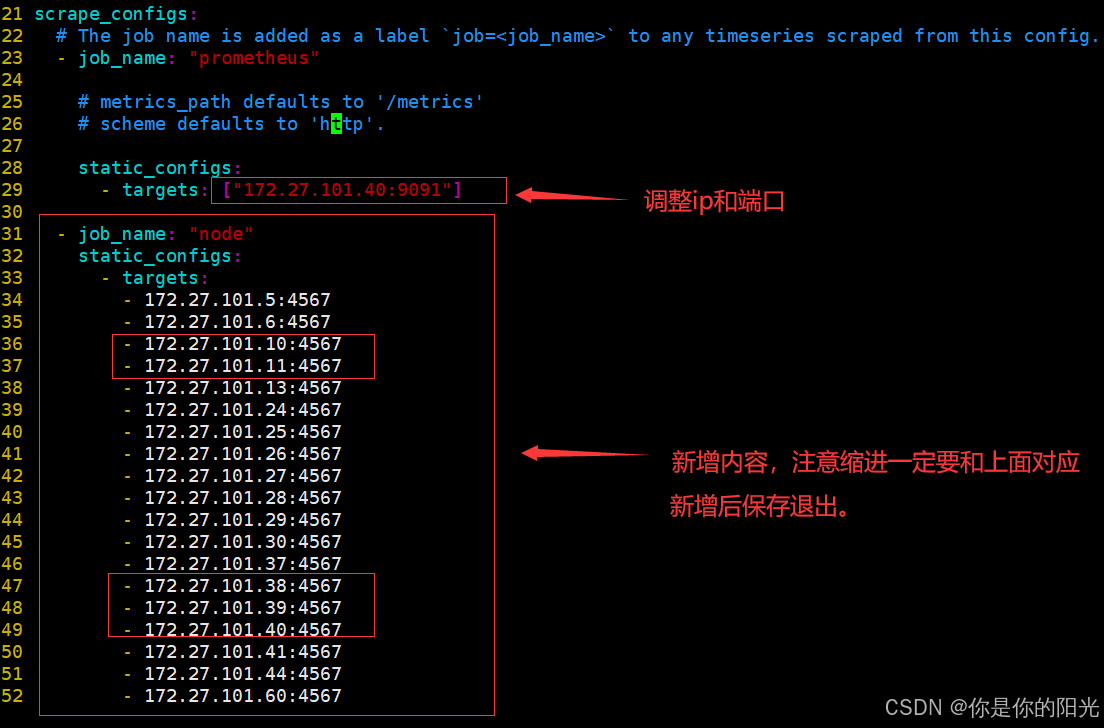
# 最后一行,将localhost:9090的主机地址改为实际ip地址(地址为172.27.101.40)
# 最后一行,将localhost:9090的端口改为9091,我们使用9091端口启动prometheus.(主要端口冲突)

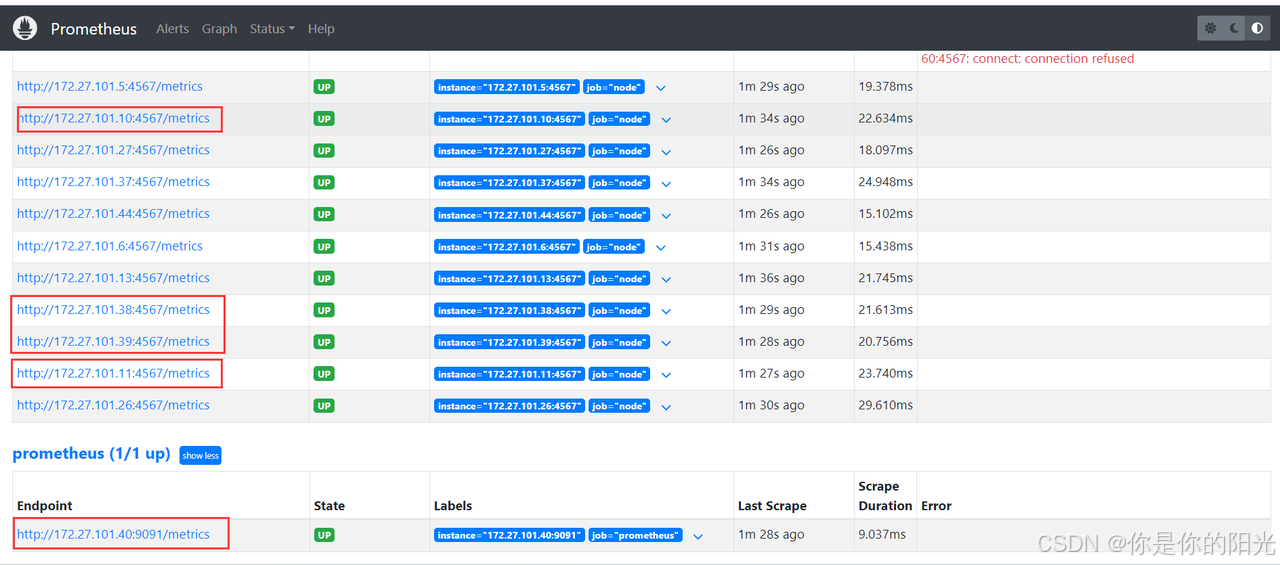
# 新增内容如下,图片在下面
  - job_name: "node"
    static_configs:
      - targets:
        - 172.27.101.10:4567
        - 172.27.101.11:4567
        - 172.27.101.38:4567
        - 172.27.101.39:4567
        - 172.27.101.40:4567

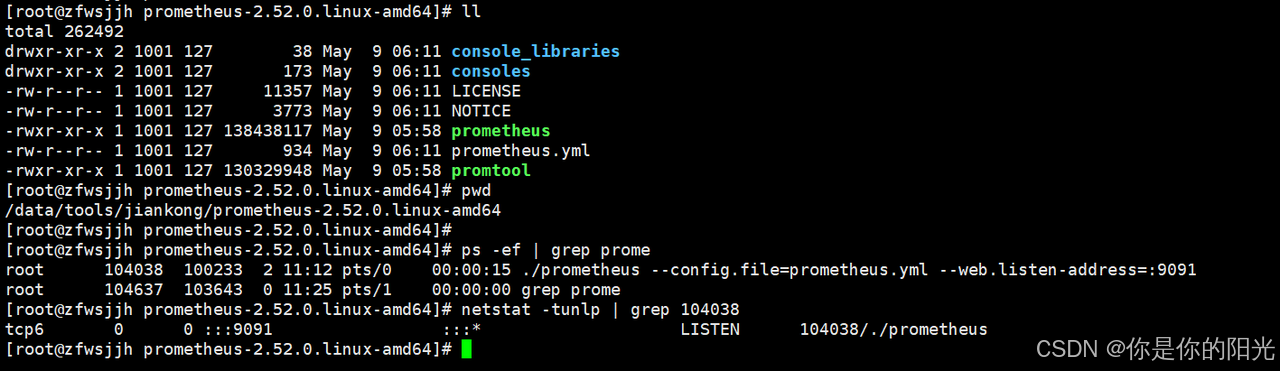
# 启动,这里不适用默认端口,使用9091端口,默认端口被占用了
nohup ./prometheus --config.file=prometheus.yml --web.listen-address=:9091 > ./nohup.out 2>&1 &

# 验证
ps -ef | grep prometheus
netstat -tunlp | grep 9091

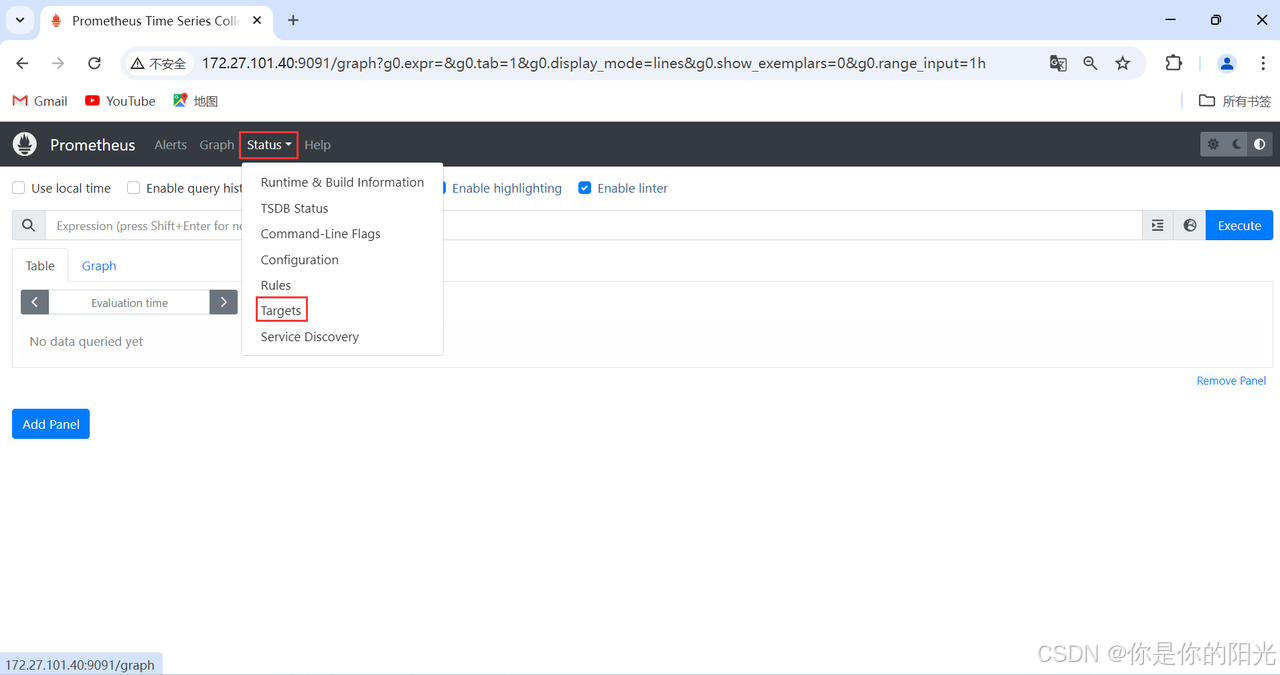
# 浏览器访问:172.27.101.40:9091
下面是详细详细配置文件。可直接替换。替换后只需要修改对应的端口和删除不用的即可。
# my global config
global:
  scrape_interval: 15s # Set the scrape interval to every 15 seconds. Default is every 1 minute.
  evaluation_interval: 15s # Evaluate rules every 15 seconds. The default is every 1 minute.
  # scrape_timeout is set to the global default (10s).

# Alertmanager configuration
alerting:
  alertmanagers:
    - static_configs:
        - targets:
          # - alertmanager:9093

# Load rules once and periodically evaluate them according to the global 'evaluation_interval'.
rule_files:
  # - "first_rules.yml"
  # - "second_rules.yml"

# A scrape configuration containing exactly one endpoint to scrape:
# Here it's Prometheus itself.
scrape_configs:
  # The job name is added as a label `job=<job_name>` to any timeseries scraped from this config.
  - job_name: "prometheus"

    # metrics_path defaults to '/metrics'
    # scheme defaults to 'http'.

    static_configs:
      - targets: ["172.27.101.40:9091"]

  - job_name: "node"
    static_configs:
      - targets:
        - 172.27.101.5:4567
        - 172.27.101.6:4567
        - 172.27.101.10:4567
        - 172.27.101.11:4567
        - 172.27.101.13:4567
        - 172.27.101.24:4567
        - 172.27.101.25:4567
        - 172.27.101.26:4567
        - 172.27.101.27:4567
        - 172.27.101.28:4567
        - 172.27.101.29:4567
        - 172.27.101.30:4567
        - 172.27.101.37:4567
        - 172.27.101.38:4567
        - 172.27.101.39:4567
        - 172.27.101.40:4567
        - 172.27.101.41:4567
        - 172.27.101.44:4567
        - 172.27.101.60:4567
  - job_name: "mysqld"
    static_configs:
      - targets:
        - 172.27.101.40:9110
        - 172.27.101.40:9111
        - 172.27.101.40:9130
7、安装采集组件mysqld_exporter
安装mysqld_exporter组件前需要在mysql服务器上创建一个监控的账号密码,然后在172.27.101.40上再安装mysqld_exporte组件,该组件只需要安装一次。
如果有多个数据库服务器也是一样,只需要在多个数据库上创建监控账号。
# 创建数据库监控账号密码
# 数据库服务器172.27.101.10、172.27.101.11都执行

# 登录mysql
mysql -u root -p

# 创建账号密码,账号为mysqld_exporter,密码为ZFdsj@135
create user 'mysqld_exporter'@'172.27.%.%' identified by 'ZFdsj@135' with max_user_connections 3;

# 分配权限
grant process, replication client, select on *.* to 'exp'@'172.27.%.%';

# 刷新权限
flush privileges;

# 退出
quit
# 安装mysqld_exporter组件
# 只需安装一次,根据部署规划,我们在172.27.101.40上安装

# 创建监控文件夹
mkdir /data/jiankong

# 进入到监控文件夹里面
cd /data/jiankong

# 上传mysqld_exporter组件
rz

# 解压
tar -zxvf mysqld_exporter-0.15.1.linux-amd64.tar.gz

# 改名
mv mysqld_exporter-0.15.1.linux-amd64 mysqld_exporter

# 进入
cd mysqld_exporter

# 创建conf和logs文件夹
mkdir conf logs

# 进入conf文件并创建连接数据库的配置文件
cd conf
touch 10.cnf 11.cnf    #10表示10数据库服务器,11表示11数据库服务器

# 编辑10.cnf和11.cnf文件
# 下面账号密码是上面我们创建的账号密码
vim 10.cnf
# 添加如下部分内容
[client]
host=172.27.101.10
port=3308
user=mysqld_exporter
password=ZFdsj@135
# 保存退出 :wq

vim 11.cnf
[client]
host=172.27.101.11
port=3308
user=mysqld_exporter
password=ZFdsj@135
# 保存退出 :wq

# 启动mysqld_exporter, 有多个cnf文件就启动多次。
nohup ./mysqld_exporter --web.listen-address=:9110  --config.my-cnf="./conf/10.cnf" > ./logs/10.log 2>&1 &

nohup ./mysqld_exporter --web.listen-address=:9111  --config.my-cnf="./conf/11.cnf" > ./logs/11.log 2>&1 &

# 验证
ps -ef | grep mysqld_exporter

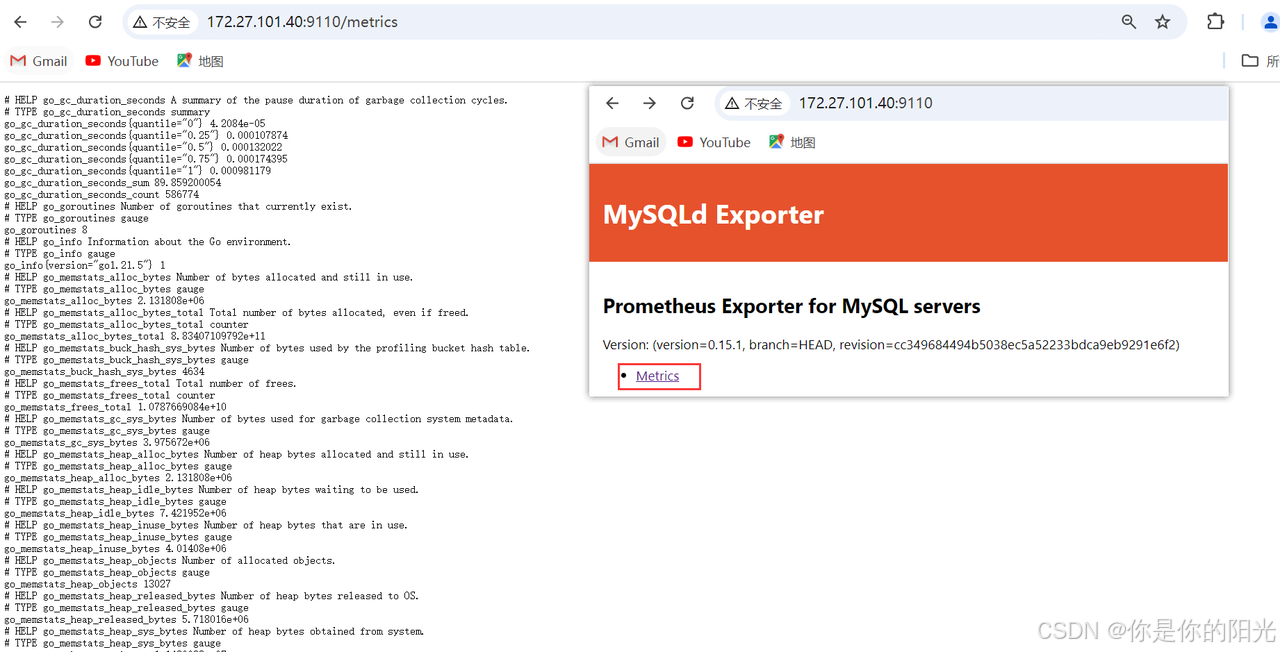
# 浏览器访问 172.27.101.40:9110/9111

8、安装web视图展示工具grafana
根据部署规划,grafana只需要安装一次,且是在172.27.101.40服务器上安装,下面开始进行操作。
grafana模板获取地址:https://grafana.com/grafana/dashboards/
# 创建监控文件夹
mkdir /data/jiankong

# 进入到监控文件夹里面
cd /data/jiankong

# 上传grafana组件
rz

# 解压
tar -zxvf grafana-enterprise-11.0.0.linux-amd64.tar.gz

# 改名
mv grafana-v11.0.0 grafana

# 进入配置目录
cd grafana/conf

# 修改defaults.ini文件,修改语言为中文。
# 只需要修改下面这一个参数,参数值为下面中的值
default_language = zh-Hans

# 进入启动目录
cd /data/jiankong/grafana/bin

# 启动 这里使用默认端口3000
nohup ./grafana-server > ./nohup.out 2>&1 &

# 验证
ps -ef | grep grafana
9、grafana图形工具界面配置(结尾)
-
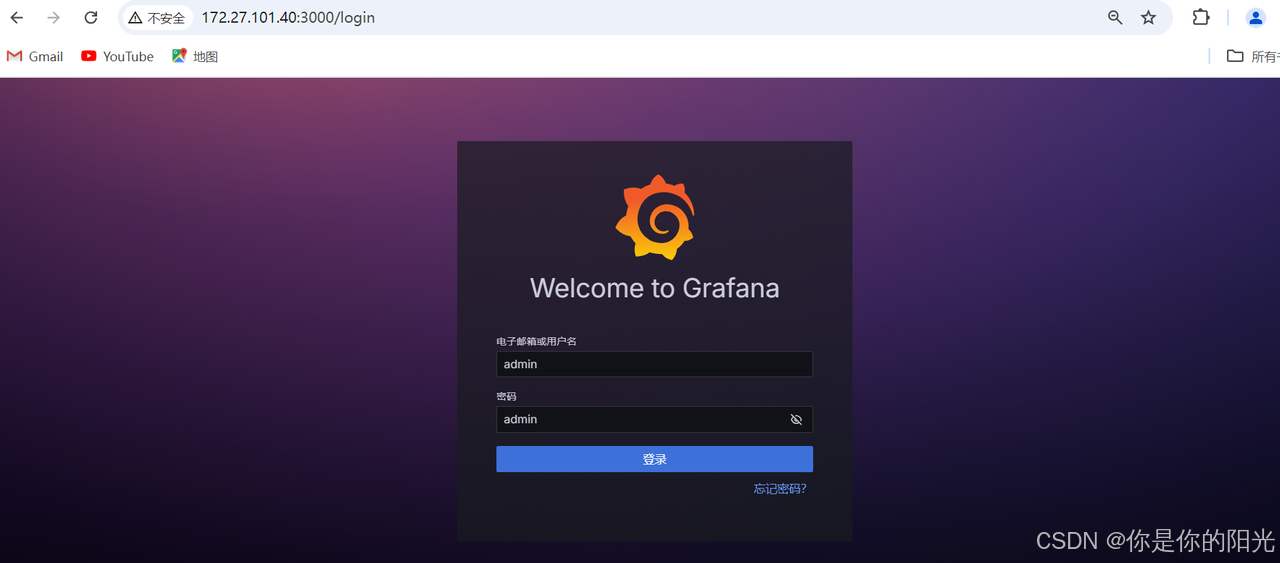
浏览器访问:172.27.101.40:3000 初始用户名和密码都是admin。如果登录界面出不来,需要升级谷歌浏览器或者切换别的浏览器访问。
-
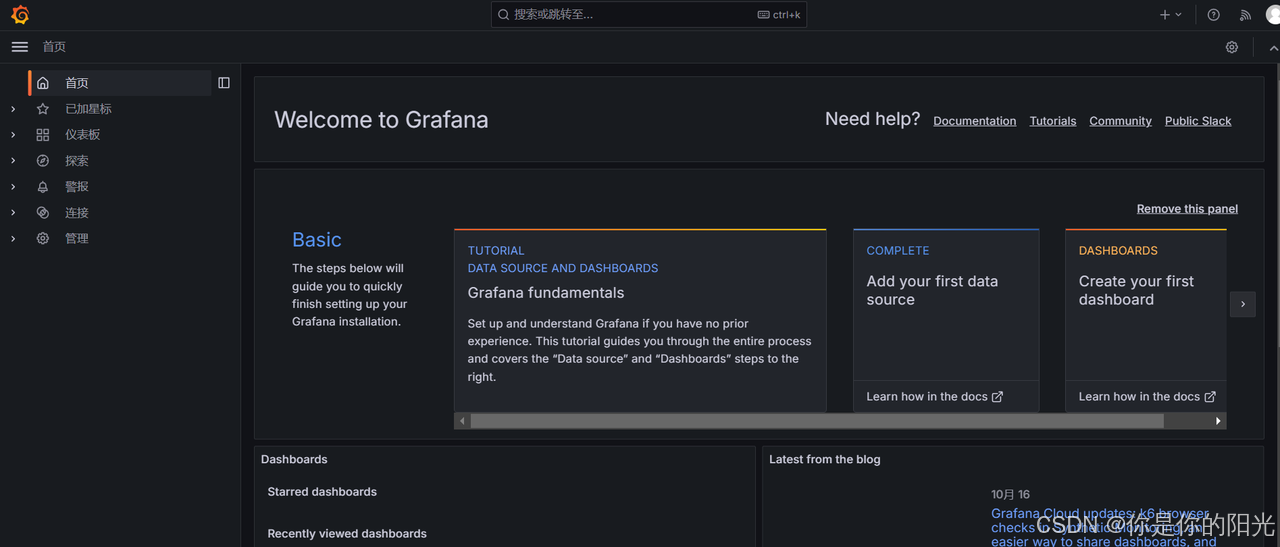
使用密码首次登录后,会出现需要修改密码的界面,修改密码后登录即可进入到首页。(这里修改密码界面不在截图展示)。
第一步
第二步
第三步
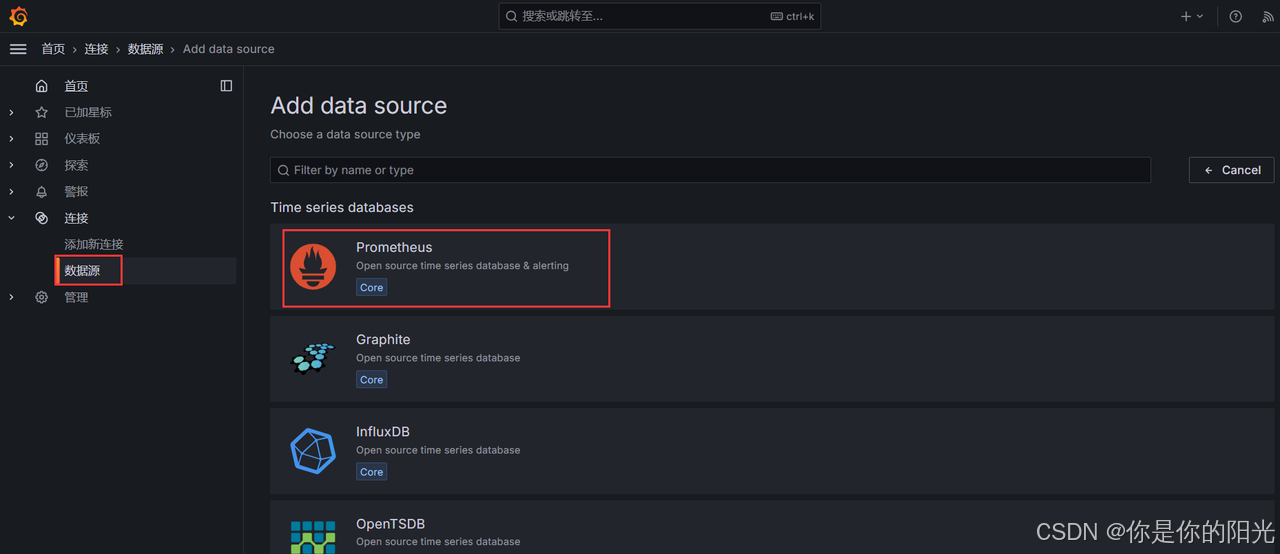
第四步
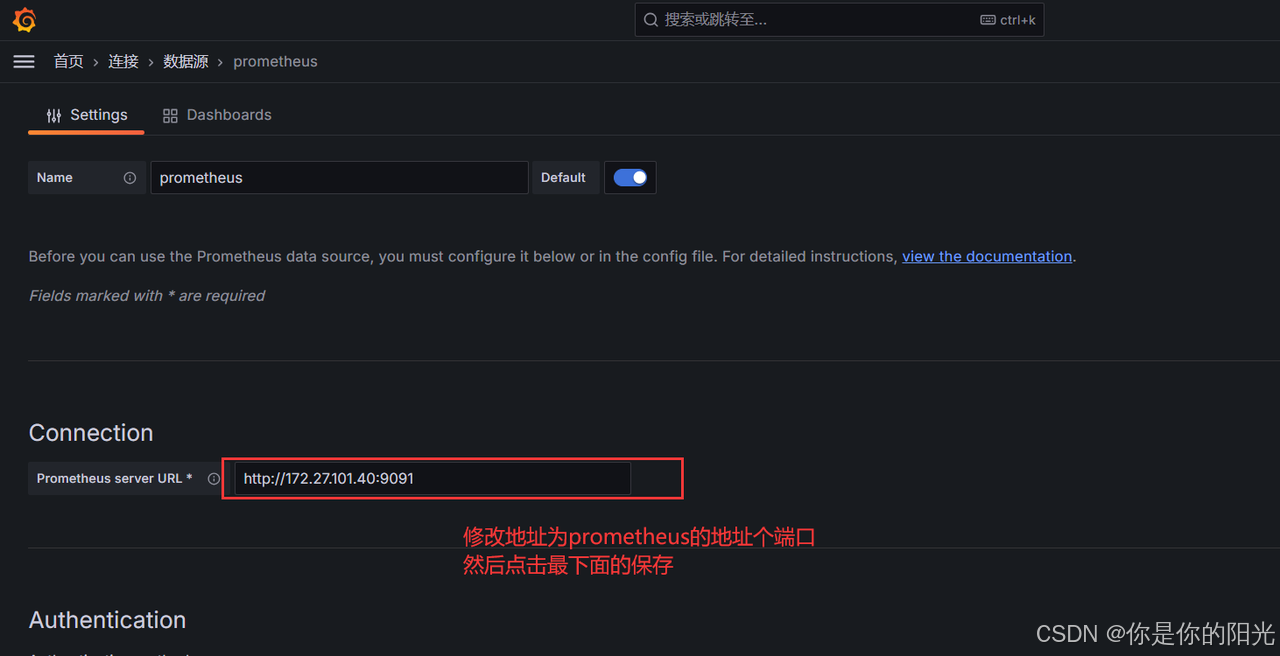
第五步
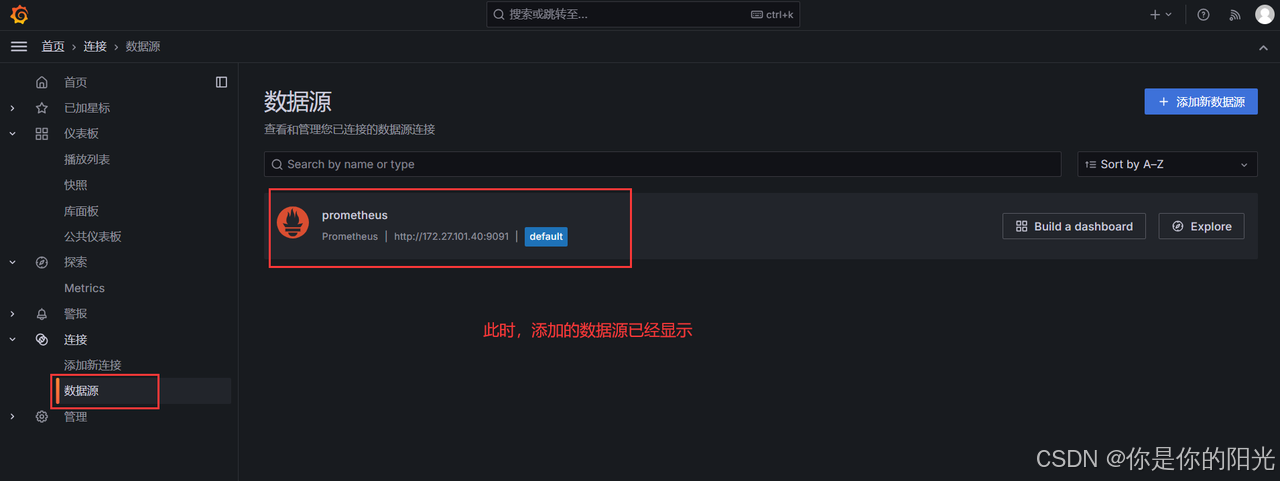
第六步
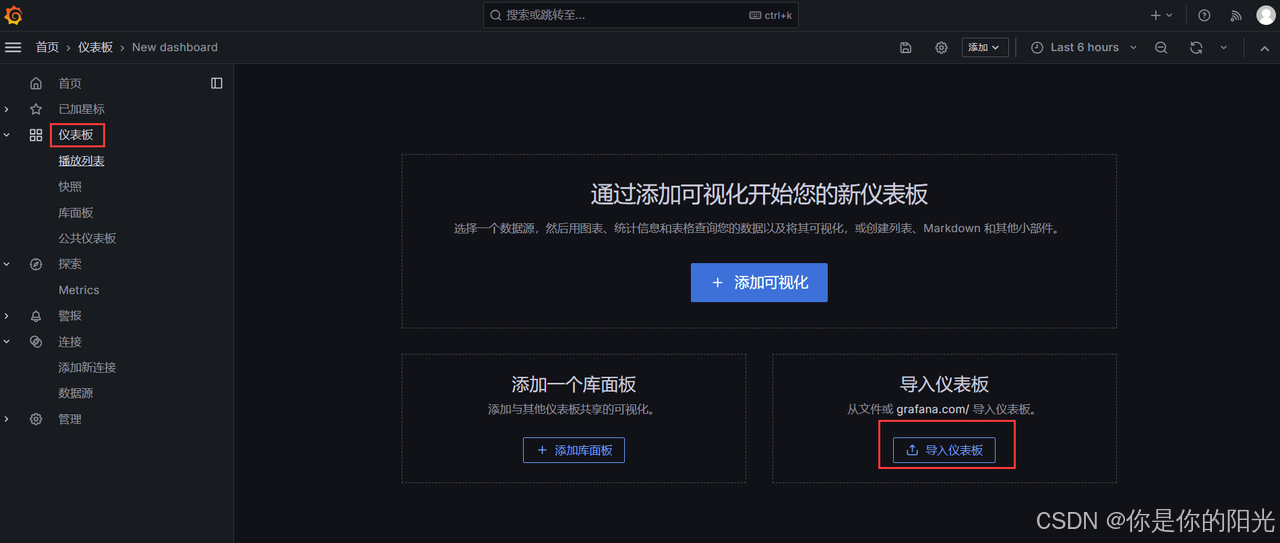
第七步
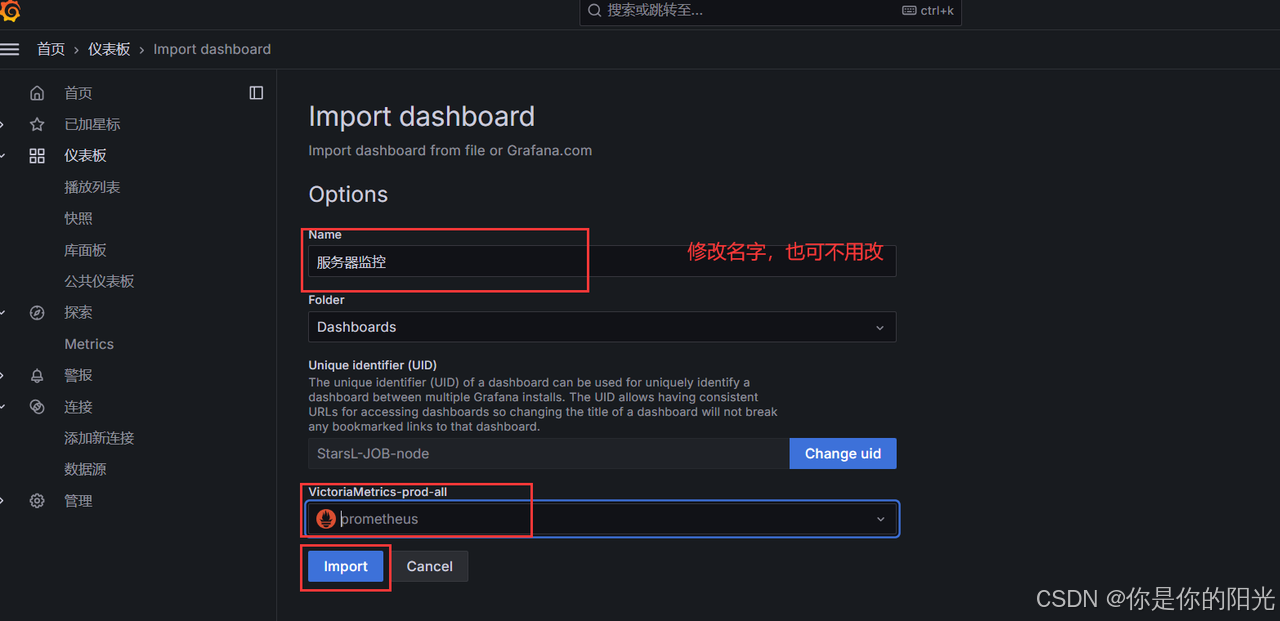
第八步
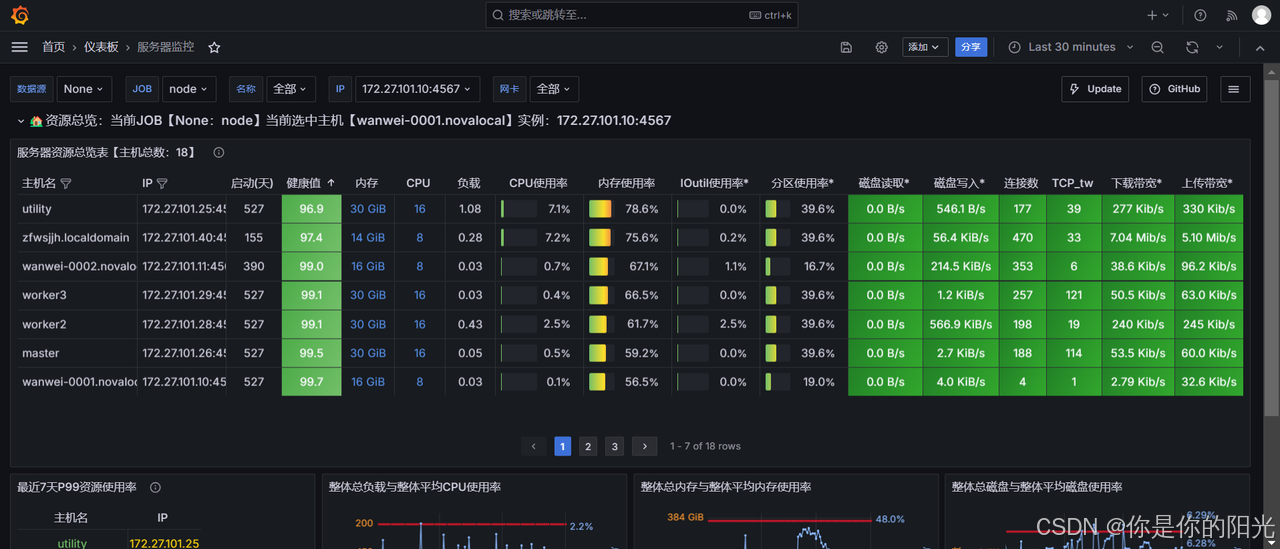
至此,搭建完成。
如还需安装监控的其它组件,可自行研究安装配置。

北京人形旗下天工造物具身智能开源社区,聚焦具身天工与慧思开物两大平台
更多推荐
 28
28 0
0- 0


 已为社区贡献1条内容

所有评论(0)