APISIX apisix-dashboard prometheus grafana整合显示仪表盘(linux同理)
·
本地环境:windows11,docker 26.1.4,apisix版本 3.9,curl 8.7.1
运行apisix
1.1下载运行项目apisix
git clone https://github.com/apache/apisix.git
其中项目中:apisix-docker\example\docker-compose.yml
最新版本(3.9)的配置文件中没有apisix-dashboard相关的启动命令,需要手动添加
1.2下载apisix-dashboard
git clone https://github.com/apache/apisix-dashboard.git
修改 apisix-docker\example\docker-compose.yml 配置文件
新增 apisix-dashboard 相关的启动命令配置,注意配置文件的地址。
  dashboard:
    image: apache/apisix-dashboard
    restart: always
    volumes:
      - 自己的路径项目路径\apisix-dashboard\api\conf\conf.yaml:/usr/local/apisix-dashboard/conf/conf.yaml:ro
    ports:
      - "9000:9000"
    networks:
      - apisix
    depends_on:
      - etcd
1.3运行
记得完成上面的配置
在apisix-docker\example目录下执行
docker-compose -p docker-apisix up -d
1.4测试运行后的
执行后会产生7个正在运行的容器
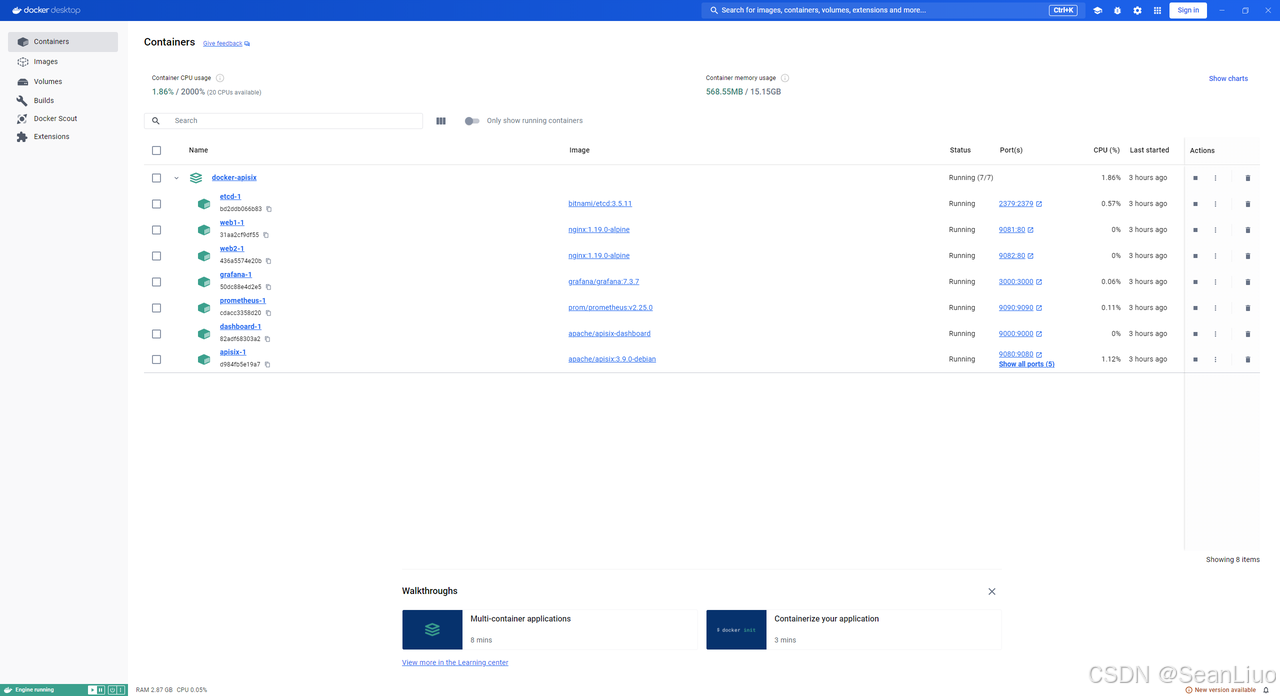
说明:
- etcd-1:APISIX 利用 etcd 作为分布式键值存储系统,使得所有节点上的配置能够实时同步并动态更新,从而确保整个服务集群具备高度的弹性和一致性。测试访问方式:控制台执行:“curl -L http://127.0.0.1:2379/version"会返回版本信息:”{“etcdserver”:“3.5.11”,“etcdcluster”:“3.5.0”}"
- web1-1:测试的服务1。测试访问:http://localhost:9081/
- web2-1:测试的服务2。测试访问:http://localhost:9081/
- grafana-1:可视化Apisix指标。测试访问:http://localhost:3000/
- prometheus-1:可视化Apisix指标。测试访问:http://localhost:9090/
- dashboard-1:后台可视化管理页面。登录账号密码为admin:admin测试访问:http://localhost:9000/
- apisix-1:网关主体。http://localhost:9080/
配置显示仪表盘
不多赘述参考大佬的文章:https://blog.csdn.net/weixin_46308183/article/details/123597183
其中可能会出现的坑
apisix或dashboard启动失败
报错信息:
manager-api尝试连接到127.0.0.1:2379上的etcd服务失败。
{"level":"warn","ts":"2024-07-10T02:47:34.210Z","logger":"etcd-client","caller":"v3@v3.5.5/retry_interceptor.go:62","msg":"retrying of unary invoker failed","target":"etcd-endpoints://0xc000148c40/127.0.0.1:2379","attempt":0,"error":"rpc error: code = DeadlineExceeded desc = latest balancer error: last connection error: connection error: desc = \"transport: Error while dialing dial tcp: lookup etcd on 192.168.65.7:53: no such host\""}
解决方法:
- 将 apisix-dashboard 的启动方式放到 docker-compose.yml 文件中(上面的步骤已经操作了)
- 修改 apisix-dashboard 的配置文件"apisix-dashboard\api\conf\conf.yaml"
  allow_list:
    - 127.0.0.1
    - ::1

  etcd:
    endpoints:
      - 127.0.0.1:2379
修改为
  allow_list:
    - 0.0.0.0/0
    - ::1

  etcd:
    endpoints:
      - etcd:2379
    timeout: 30
    max_retries: 5
重新启动apisix-dashboard的容器即可
apisix dashboard仪表盘显示不出来
问题:
配置好仪表盘不能正常,显示:已阻止此内容。请与网站所有者联系以解决此问题。
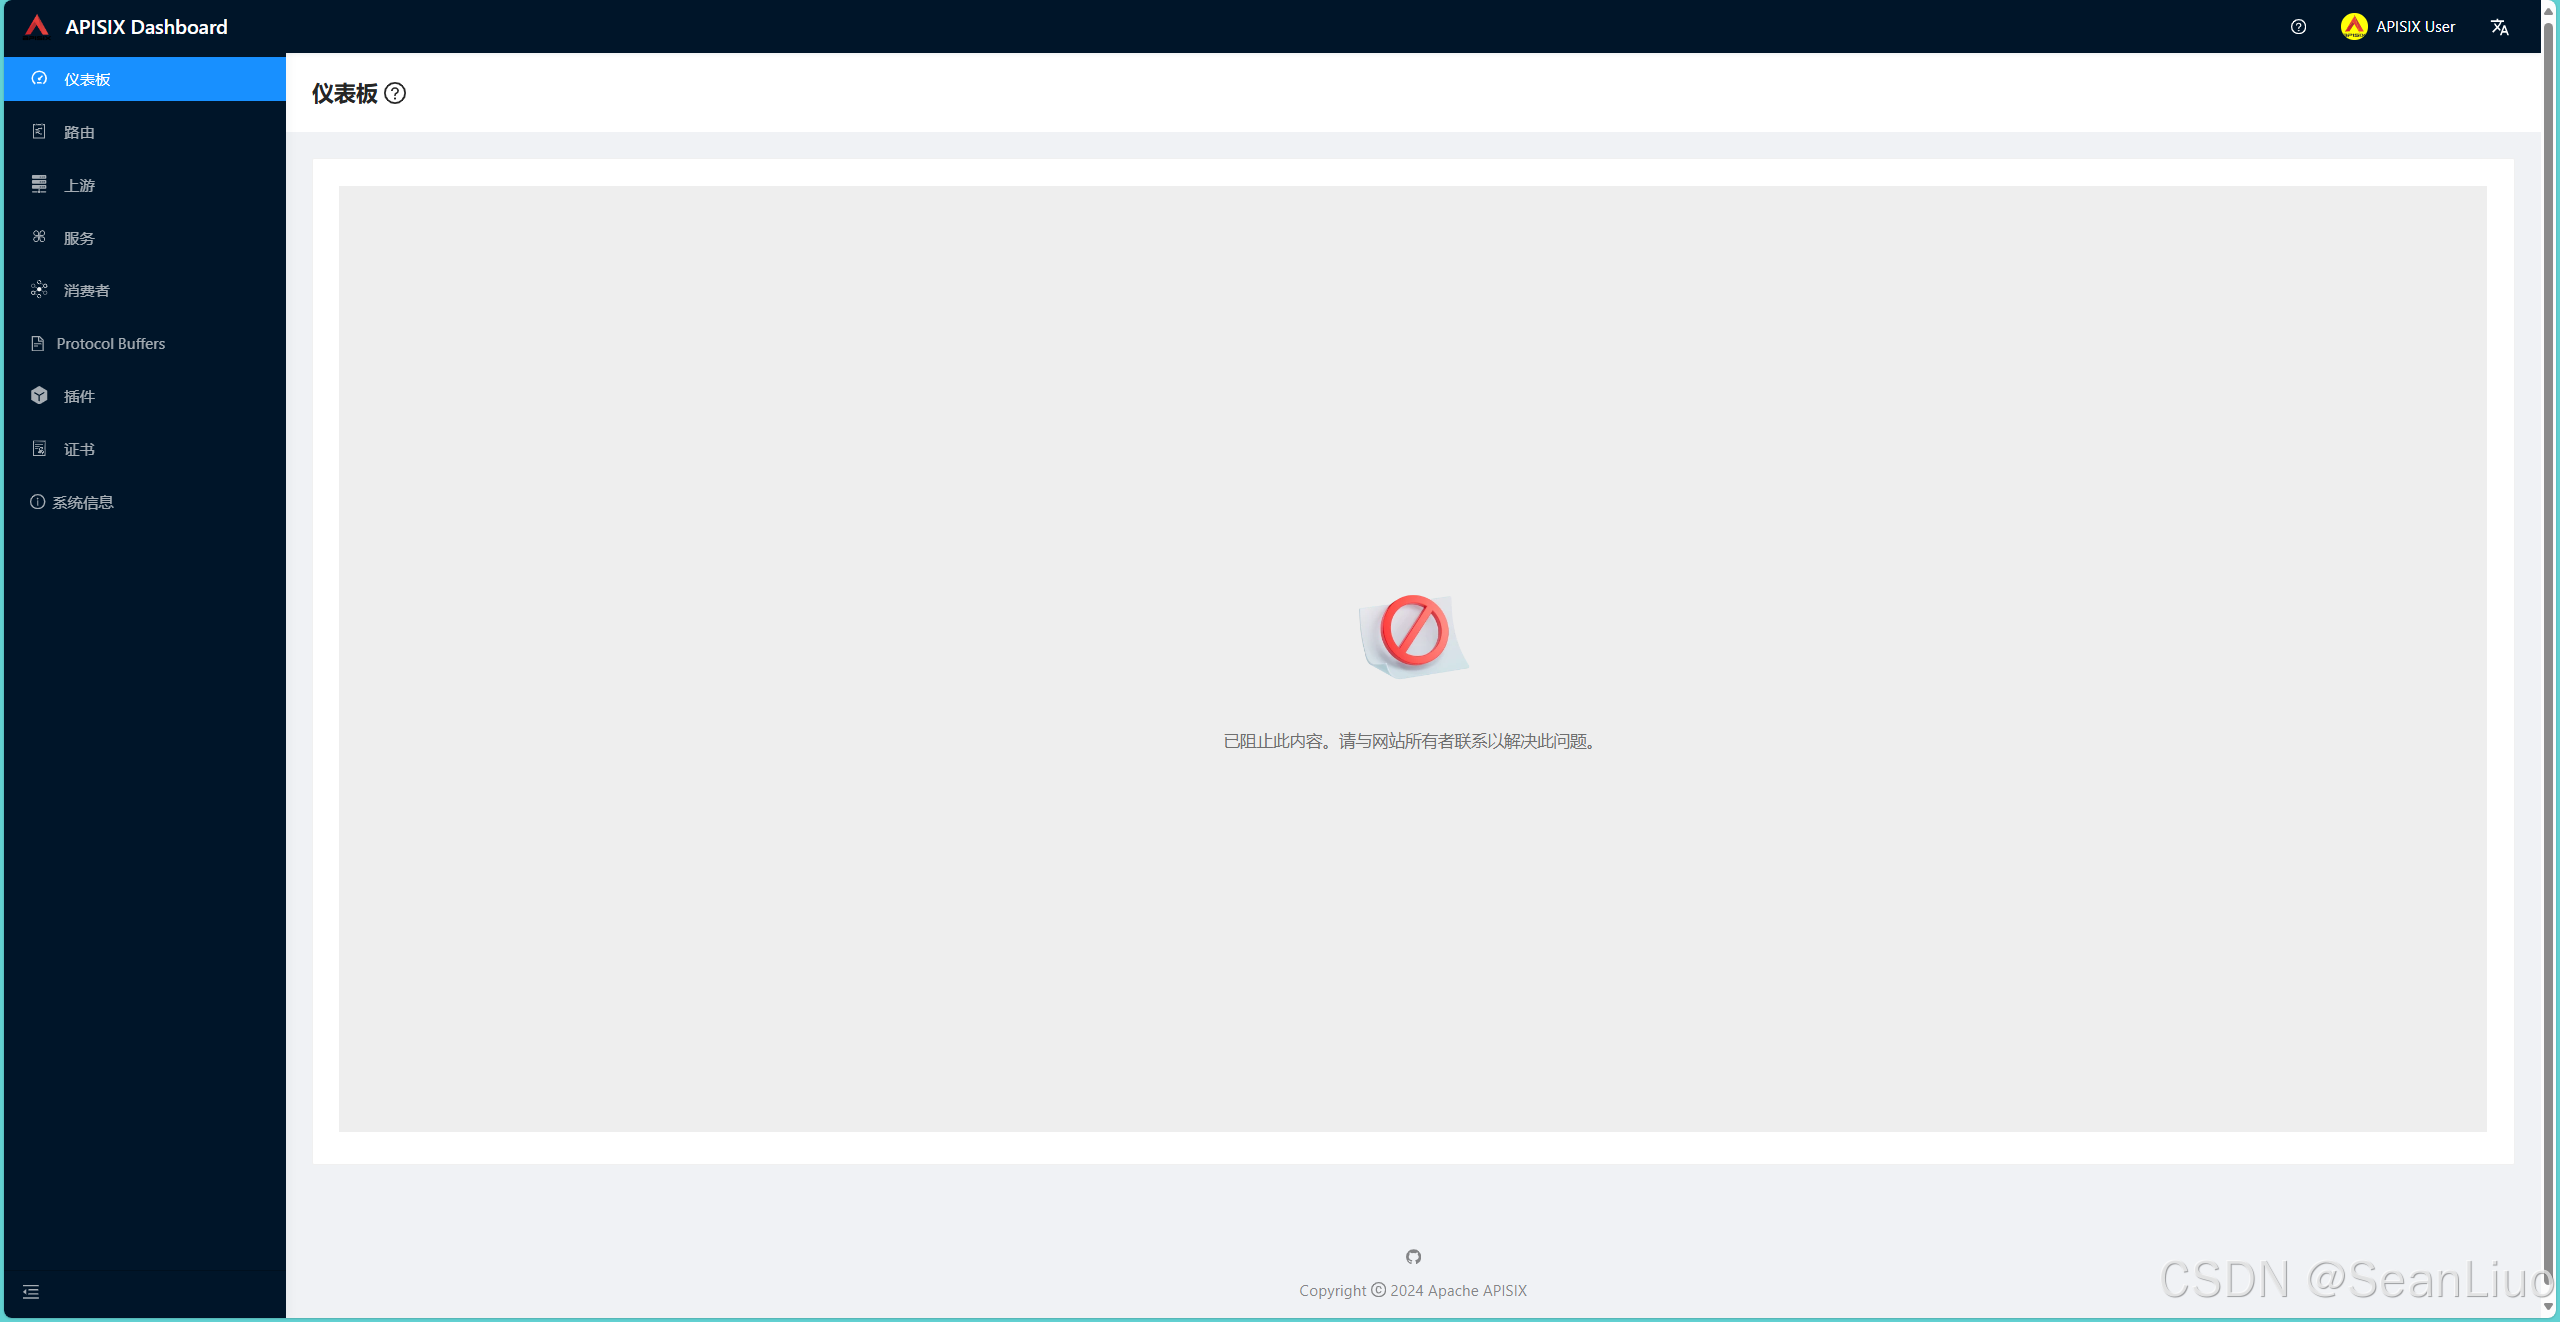
解决方法:
apisix-dashboard 的配置文件"apisix-dashboard\api\conf\conf.yaml" 新增配置
  security:
    content_security_policy: "frame-src *;"
添加位置:和etcd同级。
重新启动apisix-dashboard的容器即可
最终效果
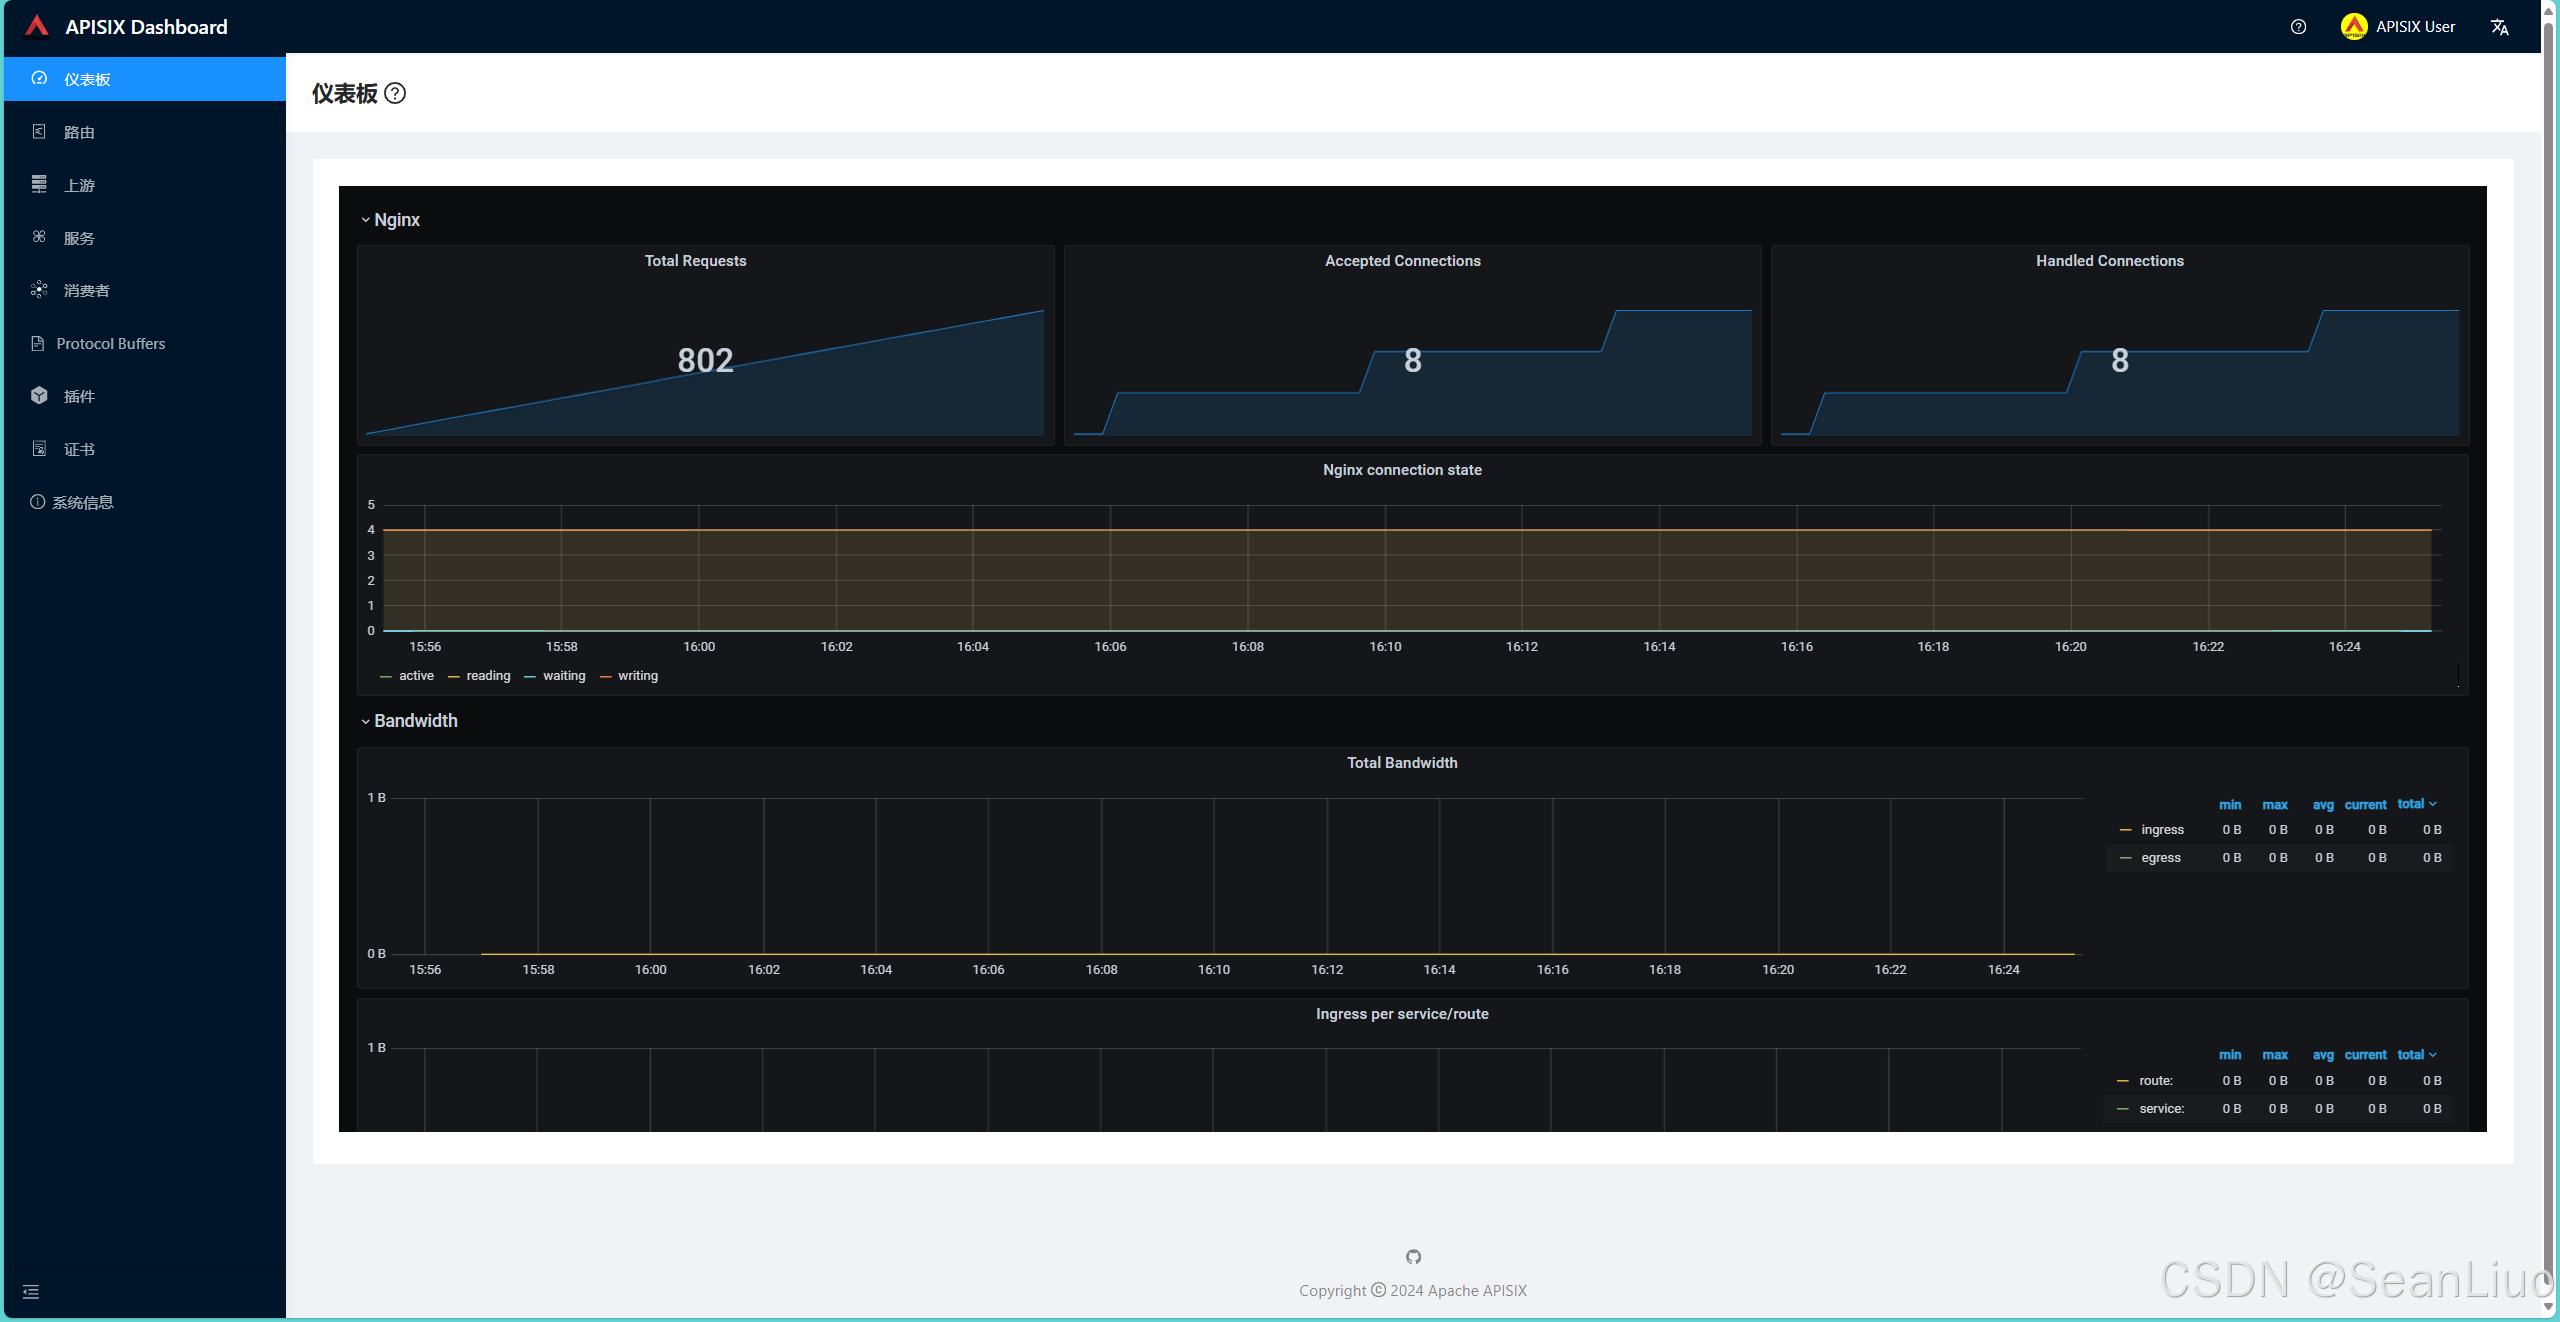
参考地址

北京人形旗下天工造物具身智能开源社区,聚焦具身天工与慧思开物两大平台
更多推荐
 50
50 0
0- 0


 已为社区贡献1条内容

所有评论(0)