C++性能分析工具gperftools安装教程与使用案例分析
·
1 什么是gperftools?
gperftools是Google Performance Tools的简称,是由谷歌开发的一套性能分析工具。它主要用于帮助开发人员进行性能分析和优化,使他们能够更好地了解其程序的性能瓶颈并进行有效的优化。gperftools包含了多个工具,其中最知名的是CPU Profiler和Heap Profiler。CPU Profiler可以帮助开发人员分析程序的CPU使用情况,找出可能的性能瓶颈;而Heap Profiler则用于检测程序中的内存泄漏和内存占用情况。除了这些主要工具外,gperftools还包含了一些其他有用的工具和库,如库的跟踪器、线程检查器和动态符号化工具等,都有助于开发人员更好地理解和优化其程序的性能。

2 gperftools安装流程
按照以下步骤安装:
- 命令行安装依赖项
其中sudo apt install autoconf automake libtool graphvizgperftools使用graphviz将代码性能分析结果进行图形化显示。graphviz是一个由 AT&T 实验室开发的开源工具包,用于绘制 DOT 语言脚本描述的图形 - 源码安装依赖项
gperftools在 64 位操作系统下需要libunwind库的支持,libunwind提供了可用于分析程序调用栈的 APIwget https://github.com/libunwind/libunwind/releases/download/v1.6.2/libunwind-1.6.2.tar.gz tar -zxvf libunwind-1.6.2.tar.gz cd libunwind-1.6.2 ./configure make -j 8 sudo make install - 源码安装
gperftools
注意这里需要使用gcc-7以上的编译器,否则会报错git clone https://github.com/gperftools/gperftools.git cd gperftools ./autogen.sh ./configure make -j 8 sudo make installconfigure: error: *** A compiler with support for C++17 language features is required. - 刷新动态库文件
sudo ldconfigldconfig可执行程序存放在/sbin目录下,通常在系统启动时运行,而当用户安装了一个新的动态链接库时,需要手动运行这个命令。运行ldconfig会刷新动态装入程序ld.so所需的链接和缓存文件/etc/ld.so.cache(此文件保存了已排好序的动态链接库名字列表),实现动态链接库为系统所共享。 - 测试安装
终端输入
返回以下帮助文档说明安装成功pprofOptions: --cum Sort by cumulative data --base=<base> Subtract <base> from <profile> before display --interactive Run in interactive mode (interactive "help" gives help) [default] --seconds=<n> Length of time for dynamic profiles [default=30 secs] --add_lib=<file> Read additional symbols and line info from the given library --lib_prefix=<dir> Comma separated list of library path prefixes --no_strip_temp Do not strip template arguments from function names Reporting Granularity: --addresses Report at address level --lines Report at source line level --functions Report at function level [default] --files Report at source file level Output type: --text Generate text report --stacks Generate stack traces similar to the heap profiler (requires --text) --callgrind Generate callgrind format to stdout --gv Generate Postscript and display --evince Generate PDF and display --web Generate SVG and display --list=<regexp> Generate source listing of matching routines --disasm=<regexp> Generate disassembly of matching routines --symbols Print demangled symbol names found at given addresses --dot Generate DOT file to stdout --ps Generate Postscript to stdout --pdf Generate PDF to stdout --svg Generate SVG to stdout --gif Generate GIF to stdout --raw Generate symbolized pprof data (useful with remote fetch) --collapsed Generate collapsed stacks for building flame graphs (see http://www.brendangregg.com/flamegraphs.html)
3 gperftools使用案例
使用以下的测试代码
#include <gperftools/profiler.h>
#include <stdio.h>
void func1() {
  int i = 0;
  int j = 0;
  for (i = 0; i < 1000; i++) {
    for (j = 0; j < 100000; j++) {
      ;
    }
  }
}
void func2() {
  int i = 0;
  int j = 0;
  for (i = 0; i < 200; i++) {
    for (j = 0; j < 100000; j++) {
      ;
    }
  }
}
void func3() {
  int i = 0;
  int j = 0;
  for (i = 0; i < 300; i++) {
    for (j = 0; j < 100000; j++) {
      ;
    }
  }
}
void func4() {
  func1();
  func2();
  func3();
}
int main() {
  ProfilerStart("my.prof"); // 指定所生成的profile文件名
  func4();
  ProfilerStop(); // 结束profiling
}
接着按以下步骤进行
- 编译代码
如果是gcc -o demo demo.c -lprofiler -lunwindCMakeLists编译,则需要链接到库target_link_libraries(${FileName} profiler ) - 运行代码并生成报告
pprof --pdf ./demo my.prof > output.pdf - 查看报告
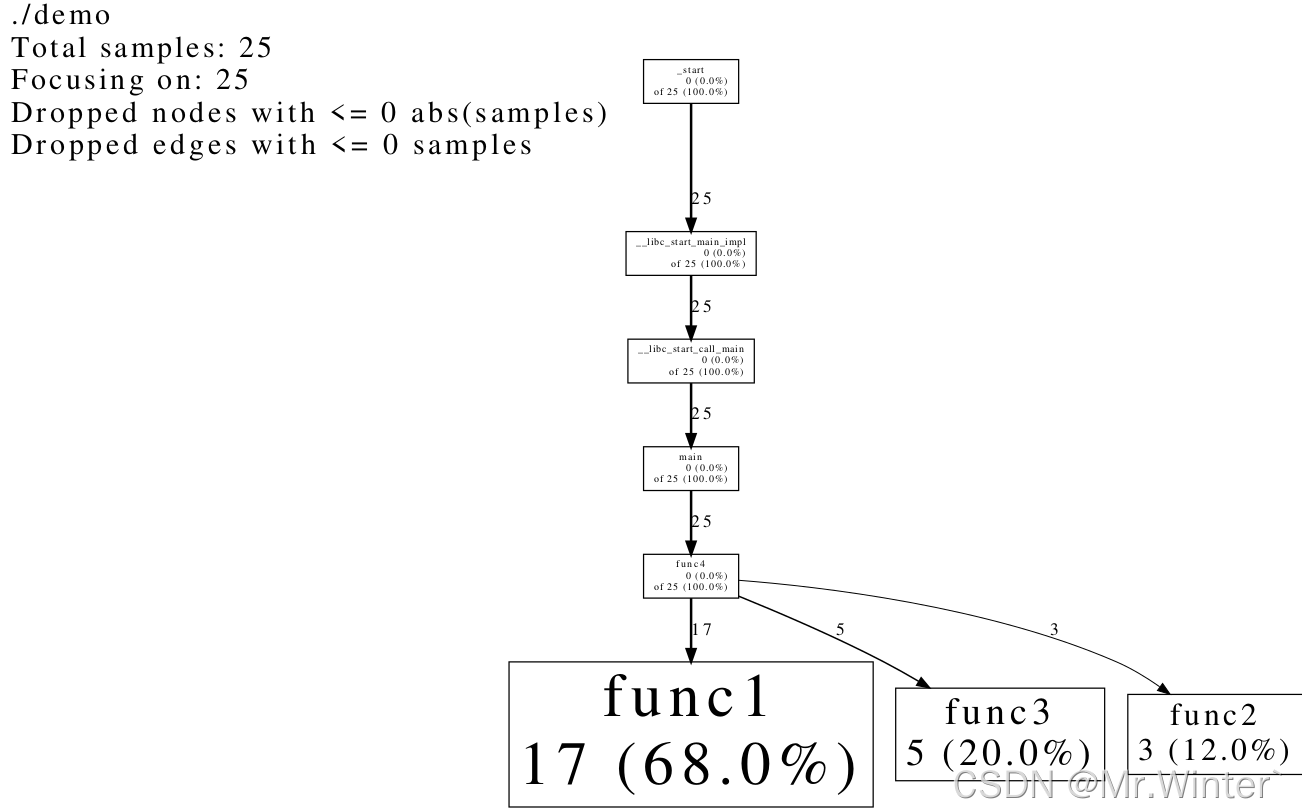
可以看到性能瓶颈在func1
🔥 更多精彩专栏:

北京人形旗下天工造物具身智能开源社区,聚焦具身天工与慧思开物两大平台
更多推荐
 43
43 0
0- 0


 已为社区贡献2条内容

所有评论(0)