使用OSWatcher监控linux/unix系统
·
简介
参考文档 (Doc ID 301137.1)
包括两个工具:
- oswbb 数据收集工具,是一组shell程序,程序中调用: top, vmstat, iostat, mpstat, netstat,
and traceroute等os的监控工具; - oswbba 数据分析工具,可以产生图形界面
windows平台没有这个工具,windows平台用Cluster Health Monitor ,可以参考文档 736752.1 。
启动和停止oswbb
启动脚本startOSWbb.sh 有四个参数
ARG1 = snapshot interval in seconds.
ARG2 = the number of hours of archive data to store.
ARG3 = (optional) the name of a compress utility to compress each file automatically after it is created.
ARG4 = (optional) an alternate (non default) location to store the archive directory.
默认参数是 30 和 48 表示每30秒收集一次信息,存放48小时。
sudo nohup ./startOSWbb.sh 30 240 & 表示每30秒收集一次数据,数据保存10天,后台运行。
sudo nohup ./startOSWbb.sh &

Info...You did not enter a value for snapshotInterval.
Info...Using default value = 30
Info...You did not enter a value for archiveInterval.
Info...Using default value = 48
Setting the archive log directory to/home/oracle/oracle.ahf/tfa/ext/oswbb/archive

Testing for discovery of OS Utilities...
VMSTAT found on your system.
IOSTAT found on your system.
MPSTAT found on your system.
IP found on your system.
TOP found on your system.
PIDSTAT found on your system.
NFSIOSTAT found on your system.
TRACEROUTE found on your system.

Discovery of CPU CORE COUNT
CPU CORE COUNT will be used by oswbba to automatically look for cpu problems

CPU CORE COUNT = 24
VCPUS/THREADS = 48

Discovery completed.

Starting OSWatcher v8.3.2  on Wed Mar 18 15:59:06 CST 2020
With SnapshotInterval = 30
With ArchiveInterval = 48

OSWatcher - Written by Carl Davis, Center of Expertise,
Oracle Corporation
For questions on install/usage please go to MOS (Note:301137.1)

Data is stored in directory: /home/oracle/oracle.ahf/tfa/ext/oswbb/archive

Starting Data Collection...

oswbb heartbeat:Wed Mar 18 15:59:11 CST 2020
[oracle@base-test-01 oswbb]$
停止用stopOSWbb.sh
收集的数据存放在archive目录下,格式如下:
<node_name>_<OS_utility>_YY.MM.DD.HH24.dat
启动oswbba
oswbba 用于分析 OSWatcher (oswbb) 收集的数据。可以产生图形界面。
运行:
java -jar oswbba.jar -i /home/oracle/oracle.ahf/tfa/ext/oswbb/archive
出现过下面的错误:
Starting OSW Analyzer V8.3.0
OSWatcher Analyzer Written by Oracle Center of Expertise
Copyright (c)  2019 by Oracle Corporation

Parsing Data. Please Wait...

Scanning file headers for version and platform info...

An exception occured in insertVmstatLists on line 1
An exception occured in insertVmstatLists on line 125
An exception occured in insertVmstatLists on line 243
An exception occured in insertVmstatLists on line 365
把archive和analyze目录删除后重新运行即可。
分析
生成dashboard
Please Select an Option:d
Enter a unique analysis/dashboard directory name or enter <CR> to accept default name:

A new analysis file analysis/base-test-01_Mar18165206_1584523889/analysis.txt has been created
拷贝到本地
scp -r oracle@192.168.????:/home/oracle/oracle.ahf/tfa/ext/oswbb/analysis/base-test-01_Mar18165206_1584523889/dashboard/* .
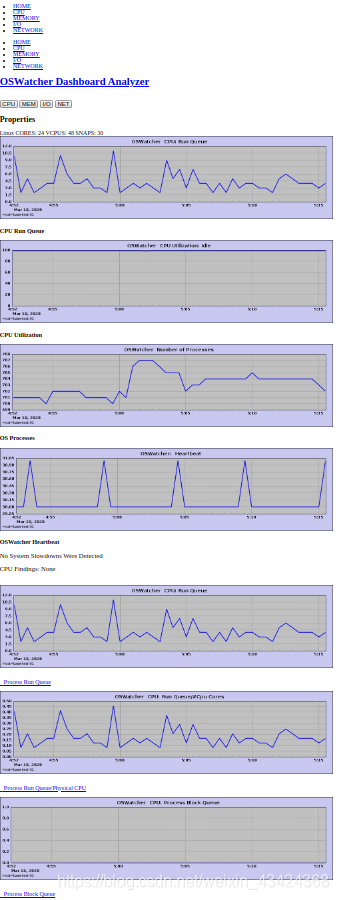
会生成系统运行的各种监控指标的图形:
生成一个时间段的分析数据
java -jar ./oswbba.jar -i ./archive -b Mar 18 22:00:00 2020 -e Mar 19 01:00:00 2020

北京人形旗下天工造物具身智能开源社区,聚焦具身天工与慧思开物两大平台
更多推荐
 0
0 0
0- 0


 已为社区贡献5条内容

所有评论(0)