prometheus监控windows系统
·
prometheus监控windows系统
本文主要介绍如何使用prometheus监控windows系统,以及在搭建监控时遇到的问题。
环境:windows
文章目录
环境准备
下载prometheus
打开prometheus的官网:https://prometheus.io/ , 点击DOWNLOAD
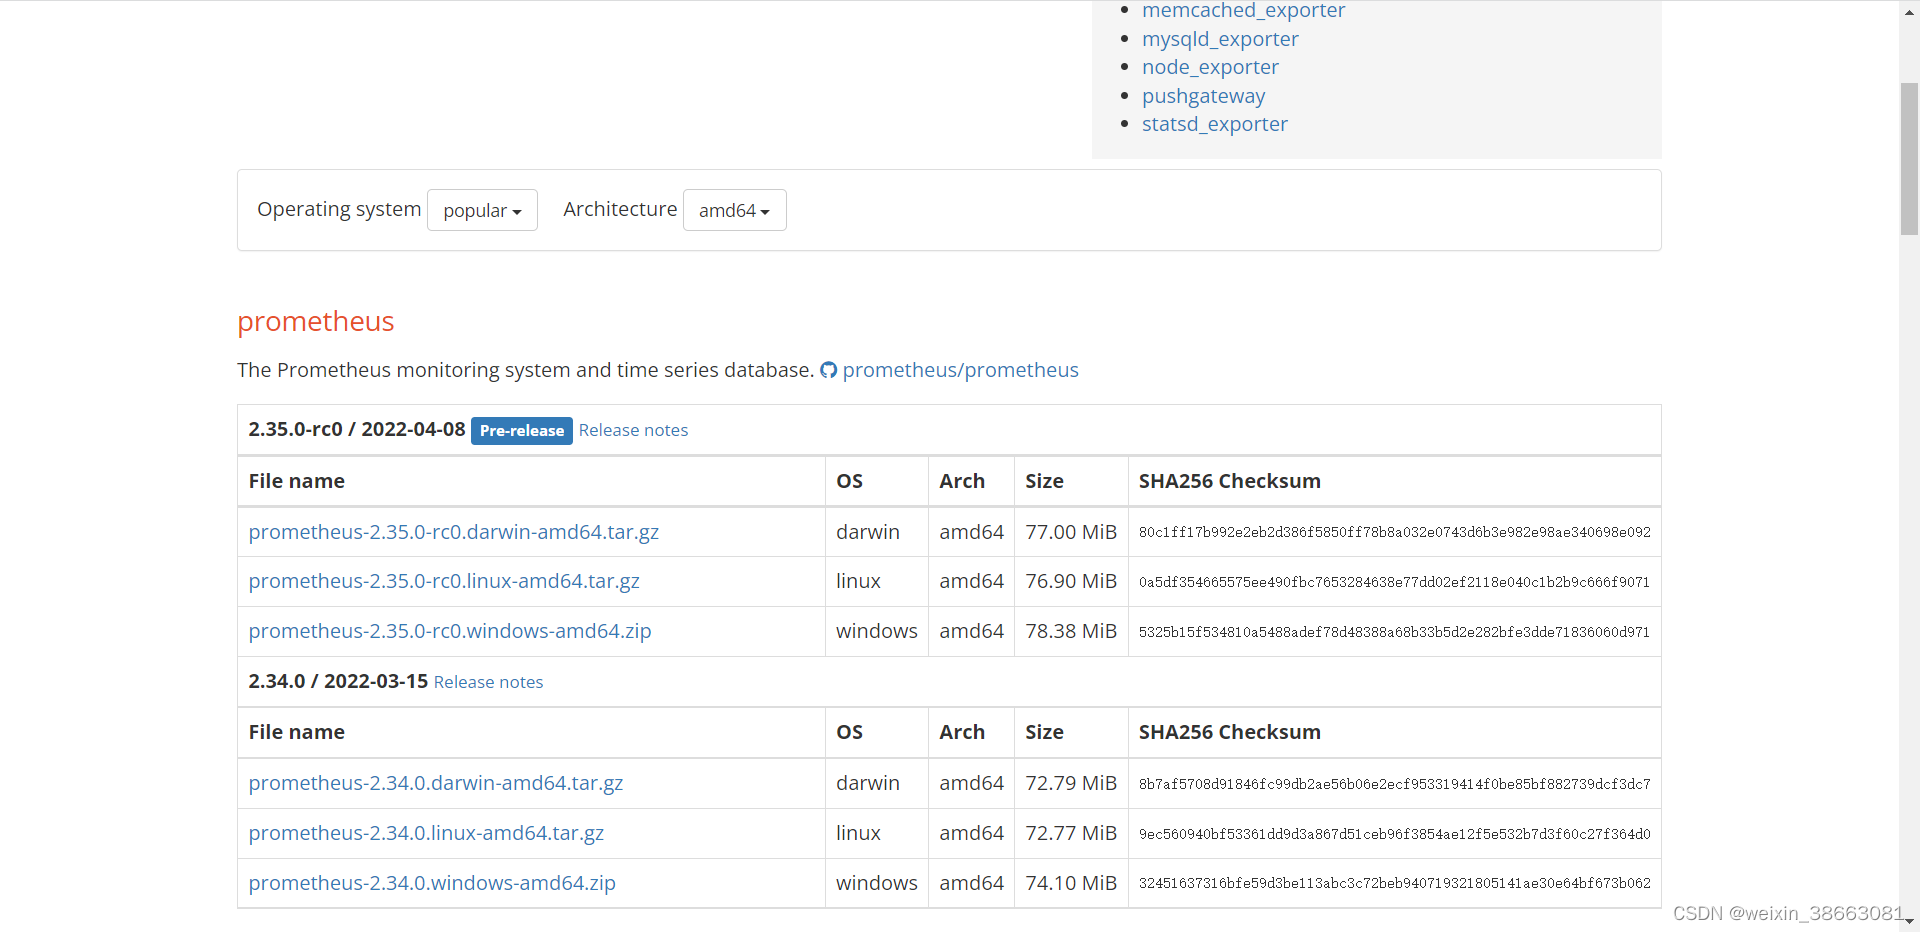
选择windows的下载
下载grafana
打开grafana官网:https://grafana.com/grafana/download
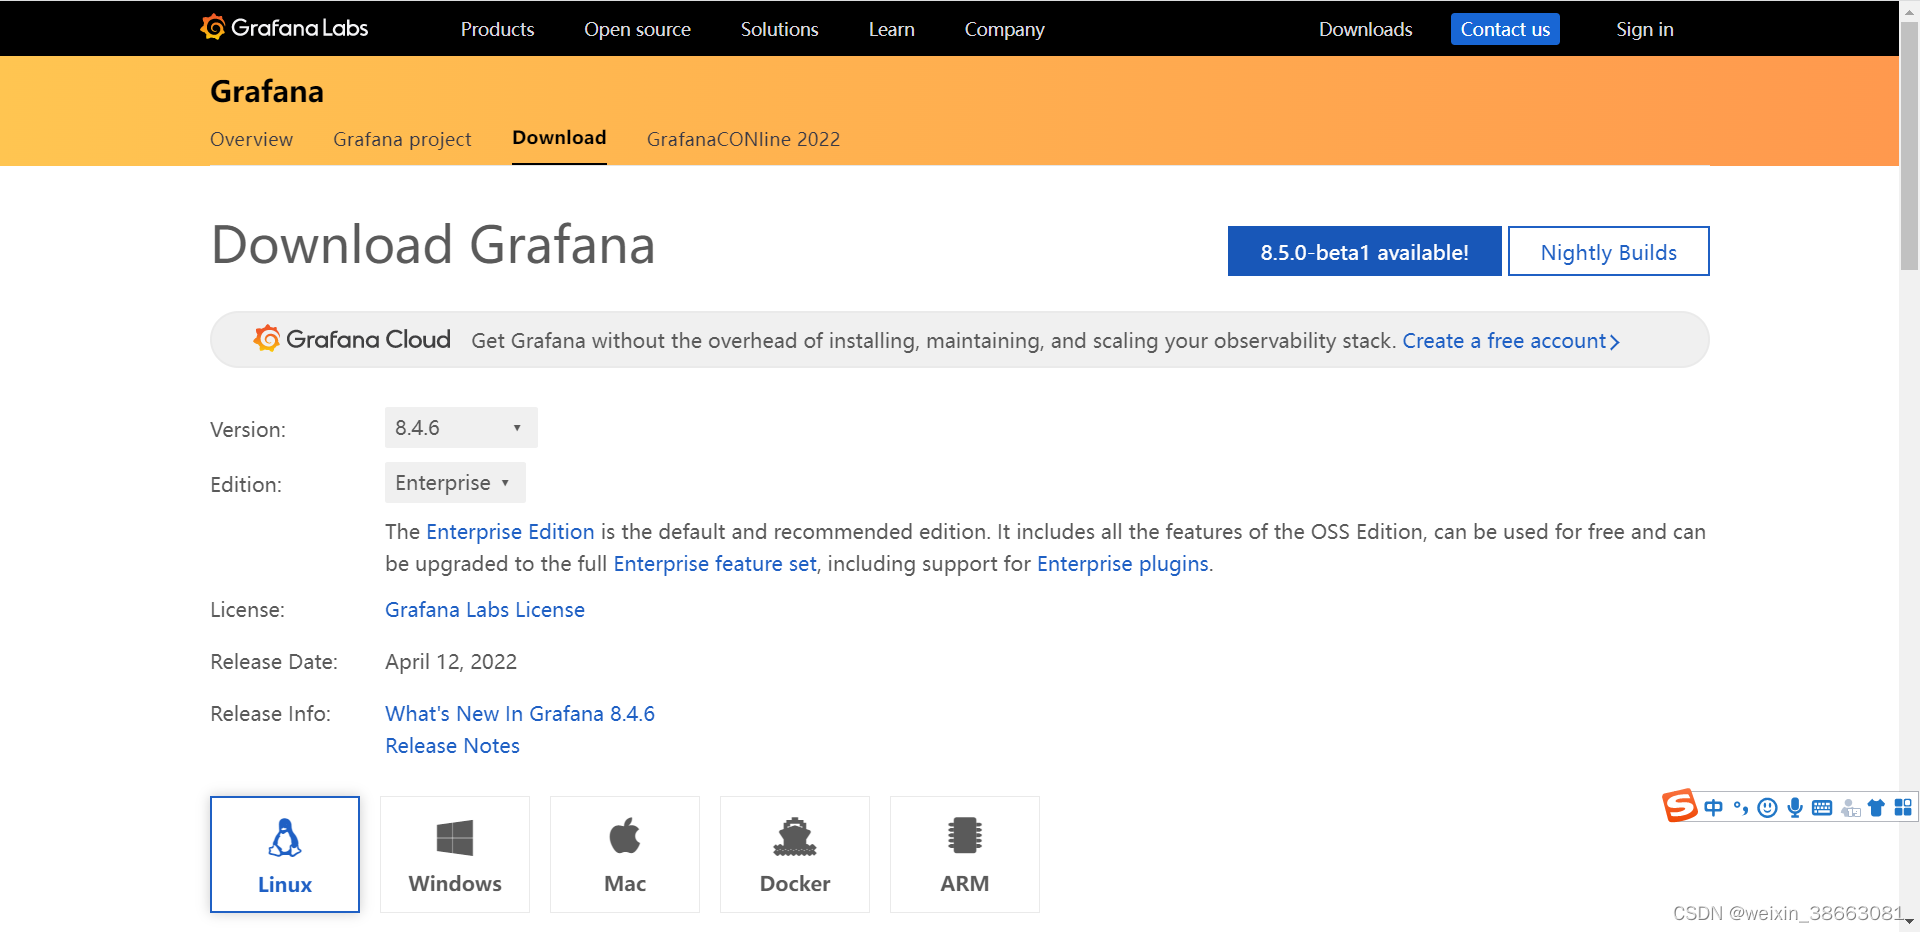
下载window版
下载windows_exporter
打开prometheus社区:https://github.com/prometheus-community/
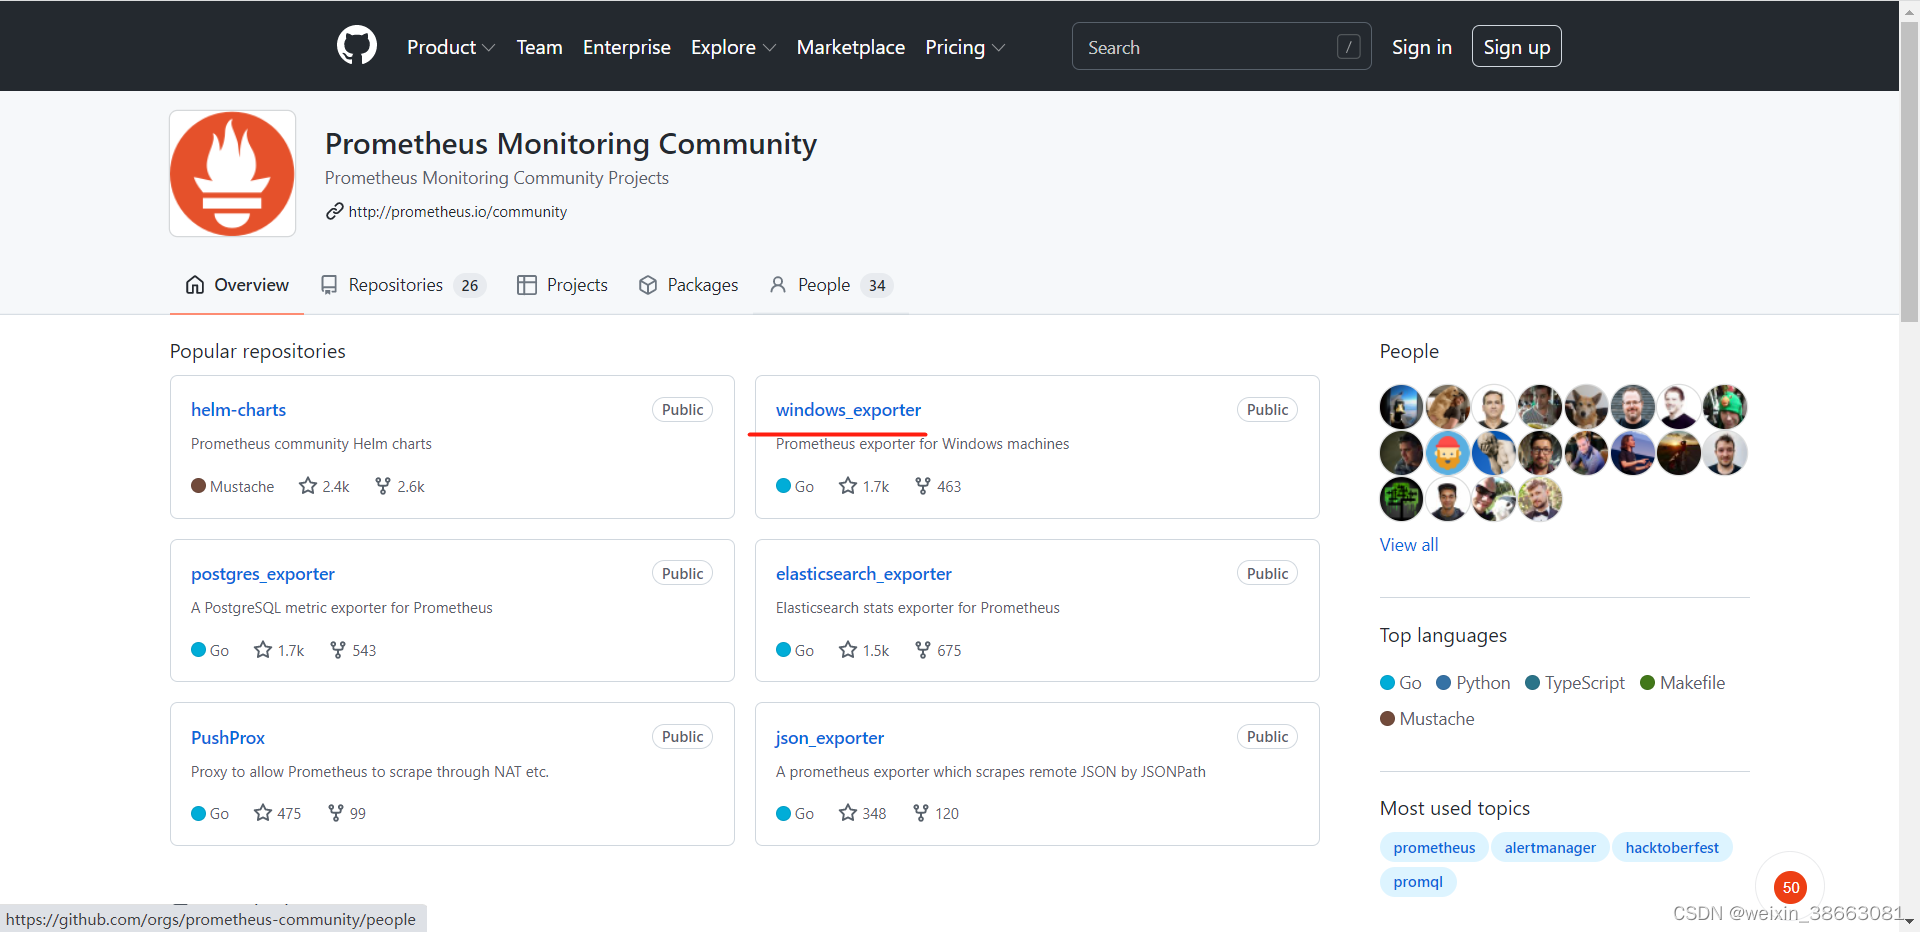
下载windows版本
一、修改配置
修改prometheus配置文件prometheus.yml,添加如下
  # winodows monitor
  - job_name: "windows_exporter"
    # metrics_path defaults to '/metrics'
    # scheme defaults to 'http'.
    static_configs:
      - targets: ["localhost:9182"]
启动 exporter prometheus grafana
二,页面操作
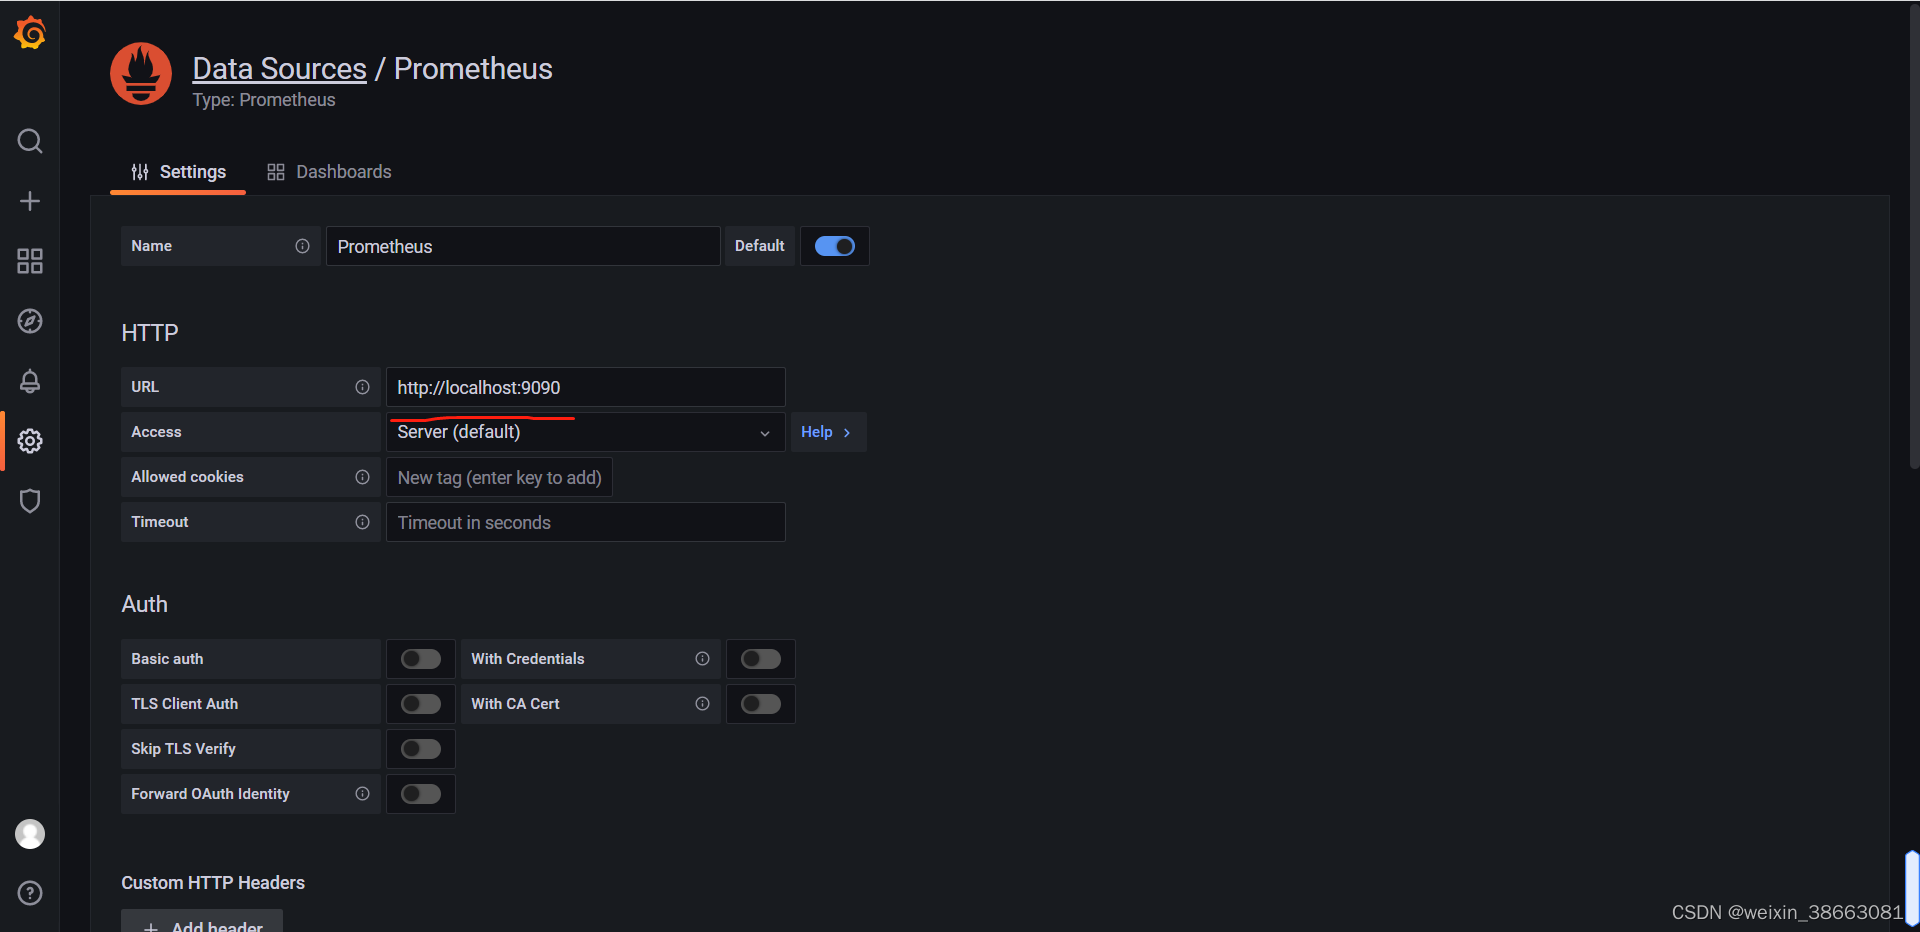
1,添加prometheus数据源
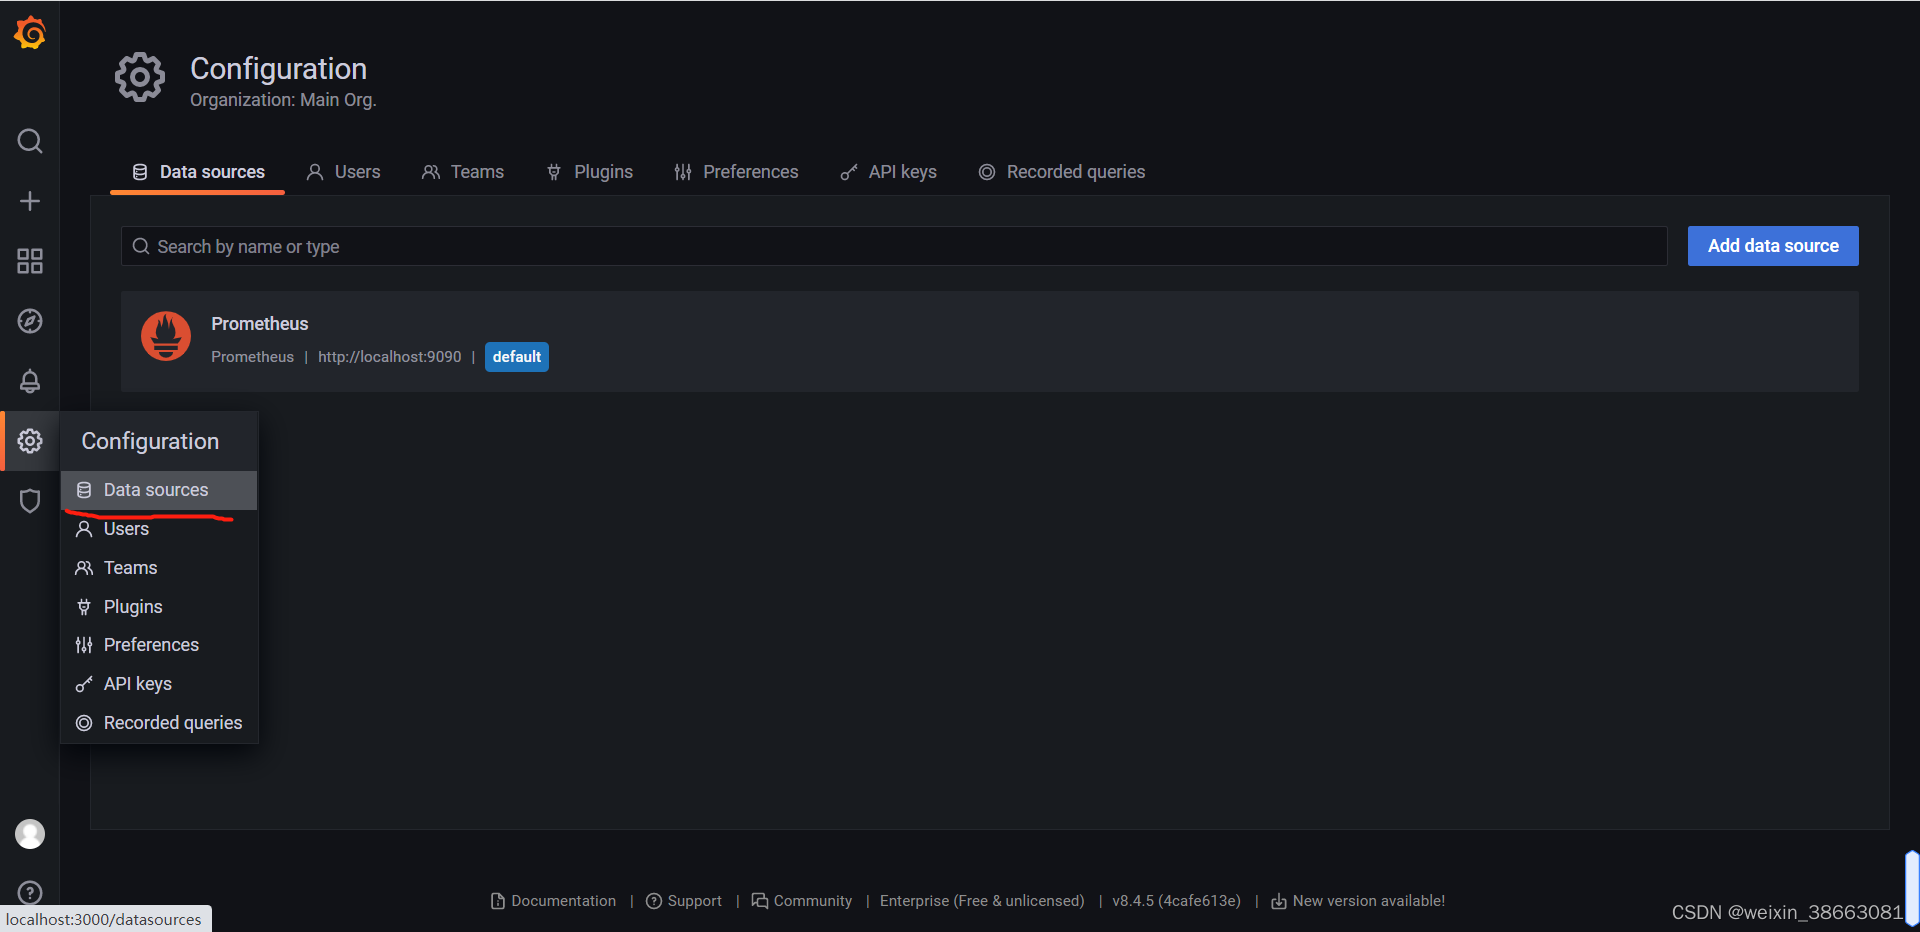
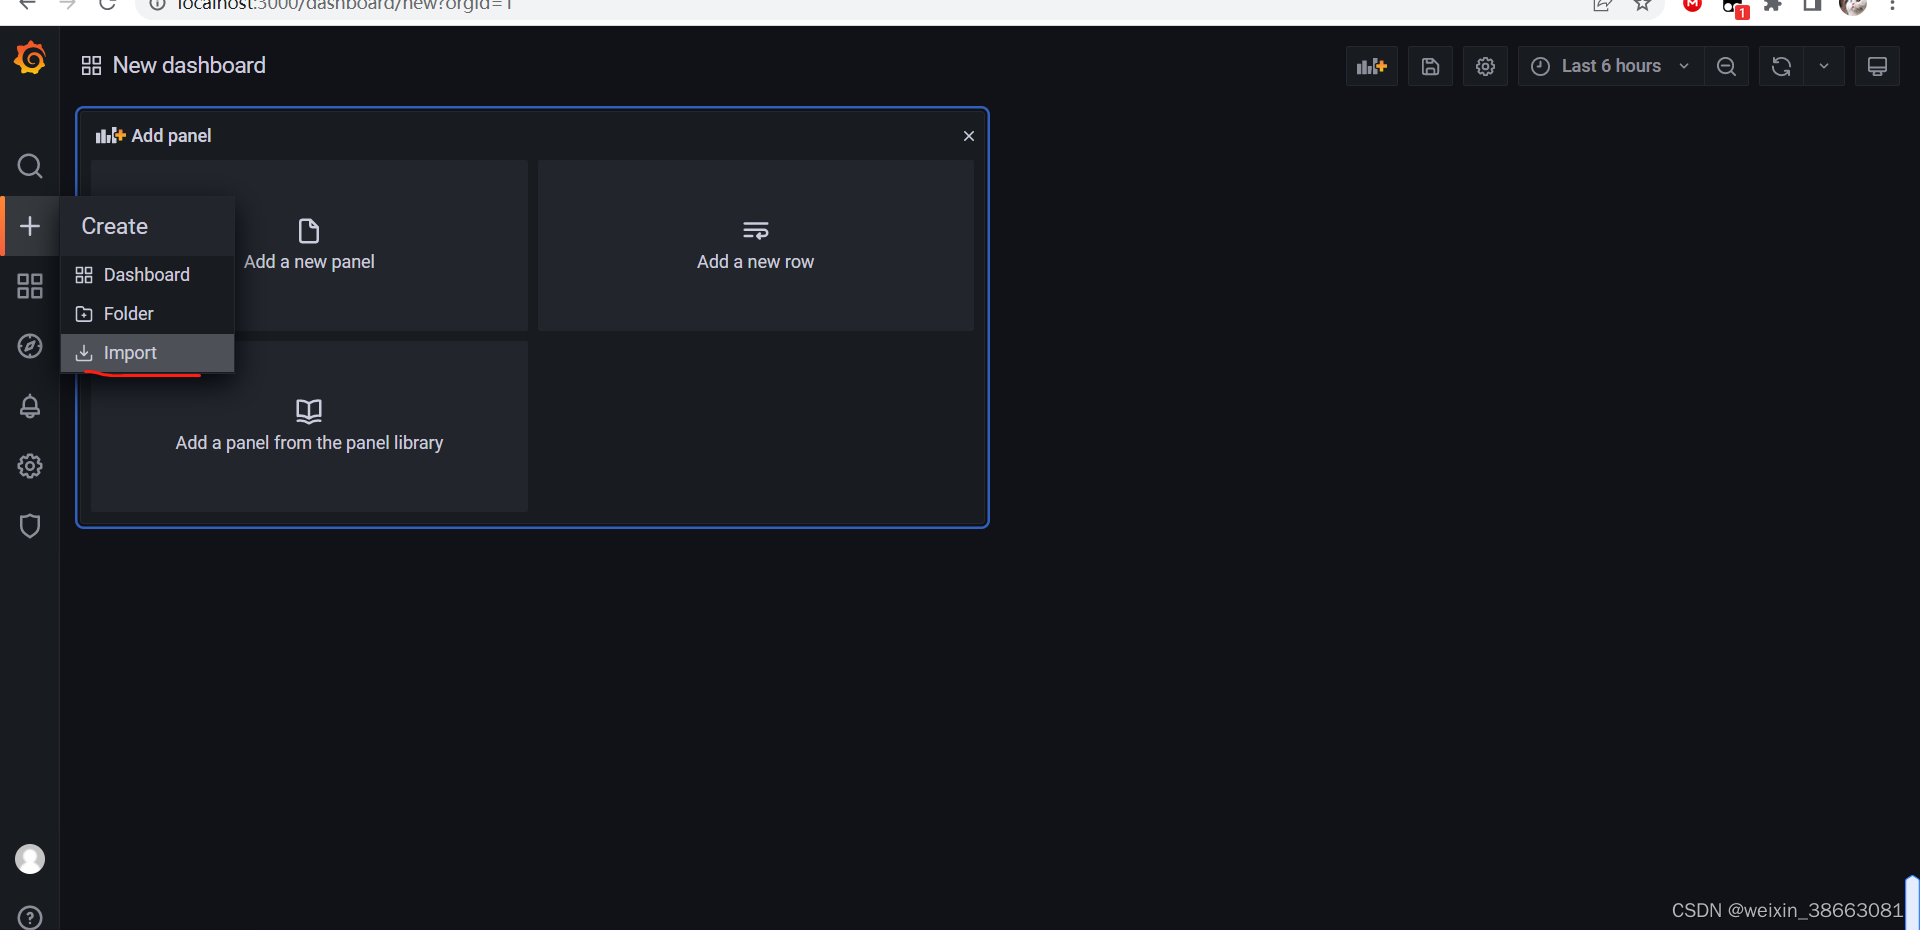
 2,导入一个DashBoard模板
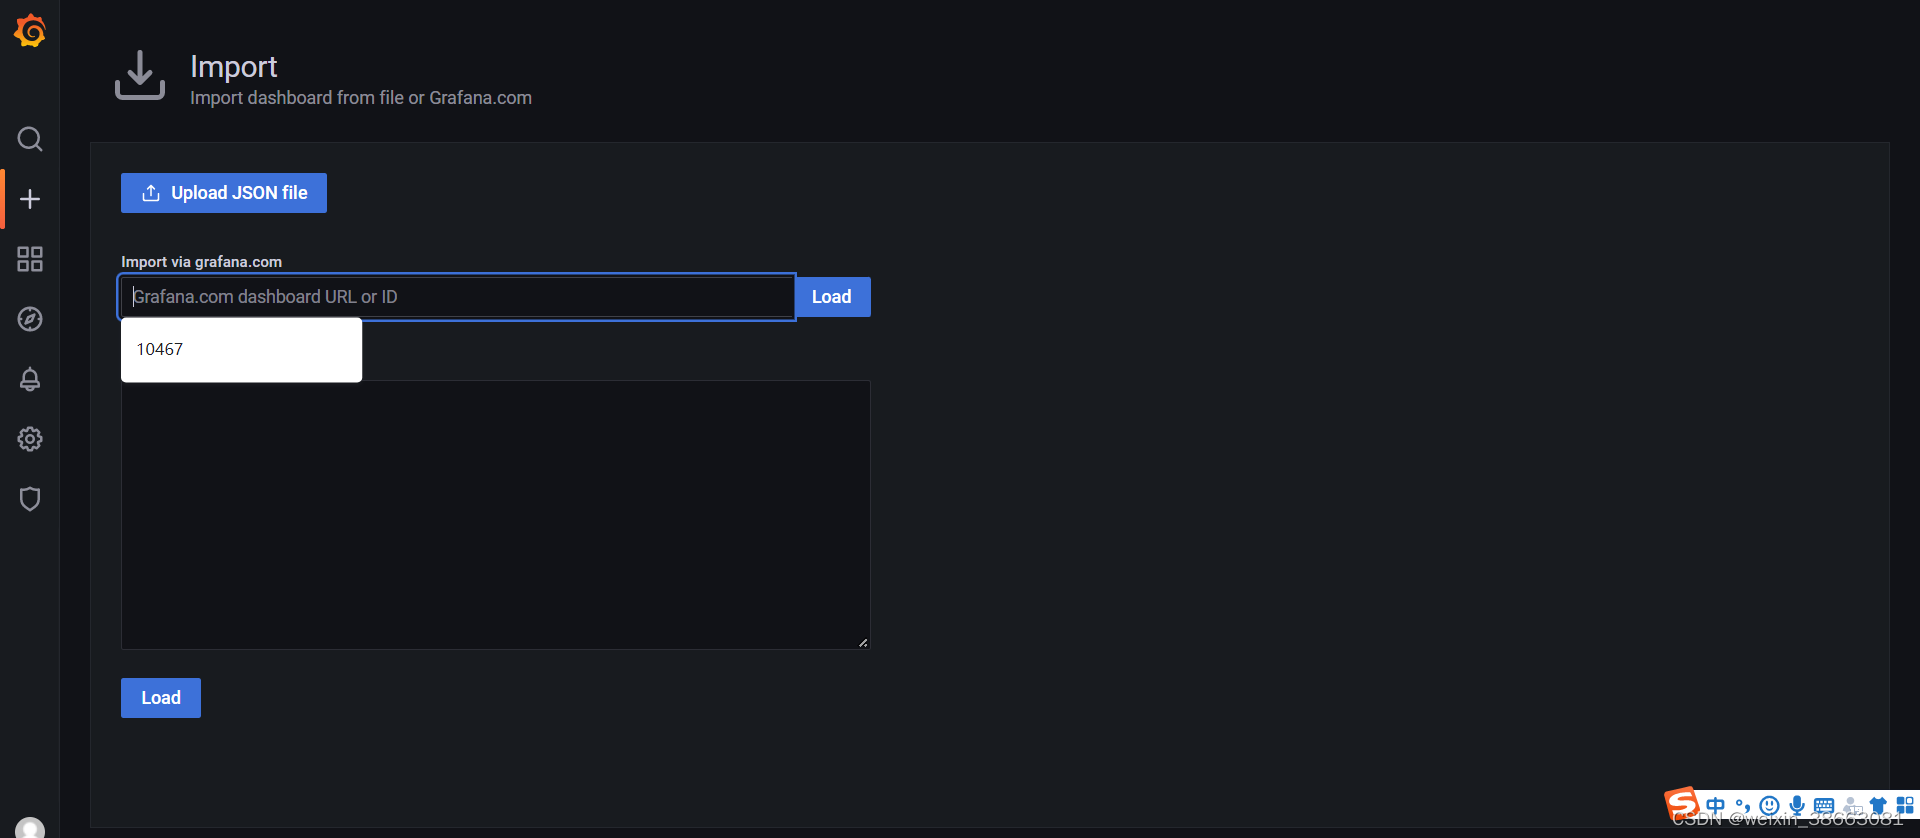
输入模板ID保存即可
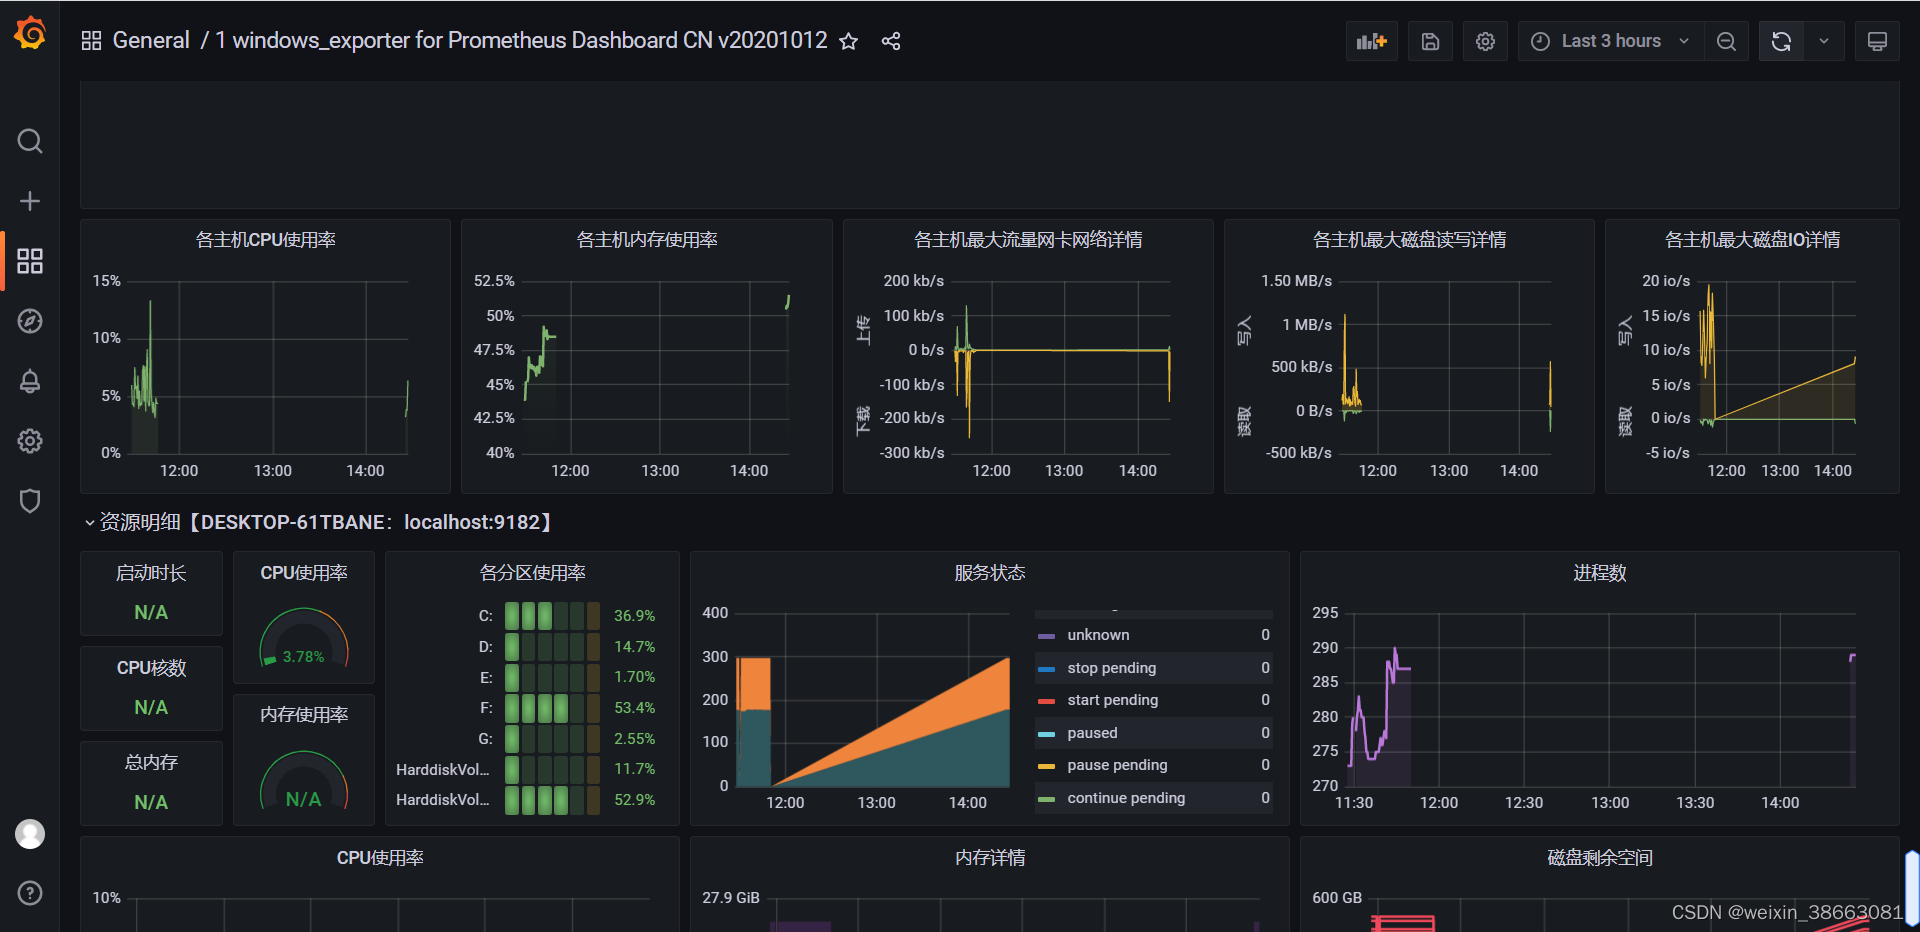
三,效果展示
四,监控邮件提醒
1,邮箱配置smtp
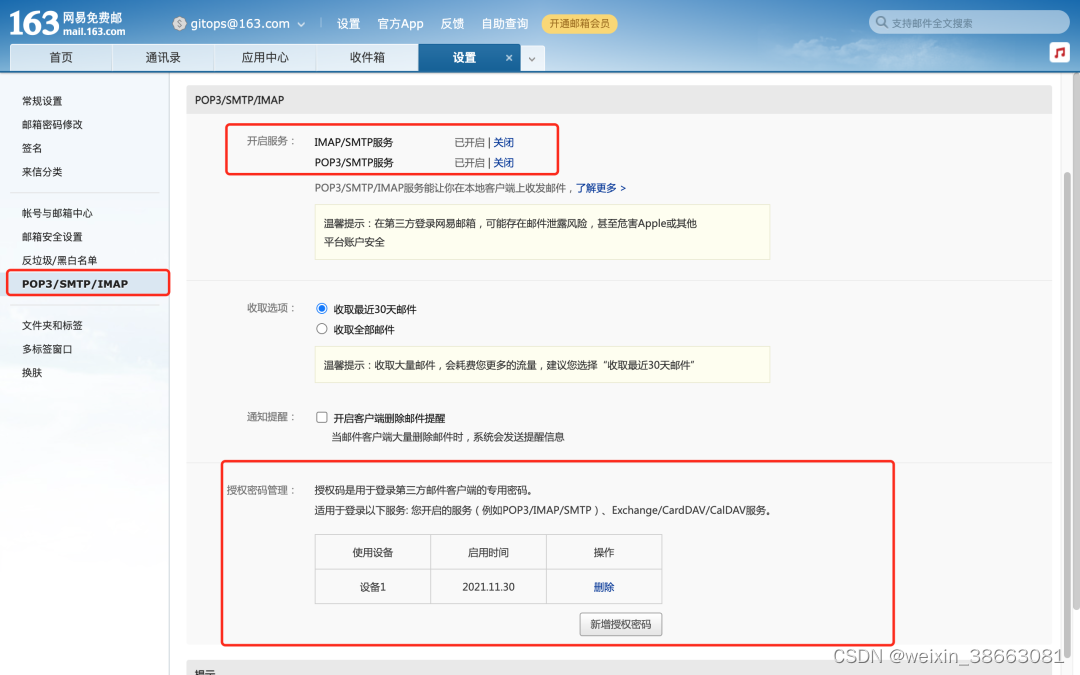
1,修改grafana配置
[smtp]
enabled = true
host = smtp.163.com:465
user = *******@163.com
# If the password contains # or ; you have to wrap it with triple quotes. Ex """#password;"""
password = ***********
cert_file =
key_file =
skip_verify = false
from_address = *********@163.com
from_address需跟user一致
[alerting]
# Enable the legacy alerting sub-system and interface. If Unified Alerting is already enabled and you try to go back to legacy alerting, all data that is part of Unified Alerting will be deleted. When this configuration section and flag are not defined, the state is defined at runtime. See the documentation for more details.
enabled = true

# Makes it possible to turn off alert execution but alerting UI is visible
execute_alerts = true
2,添加接收邮箱
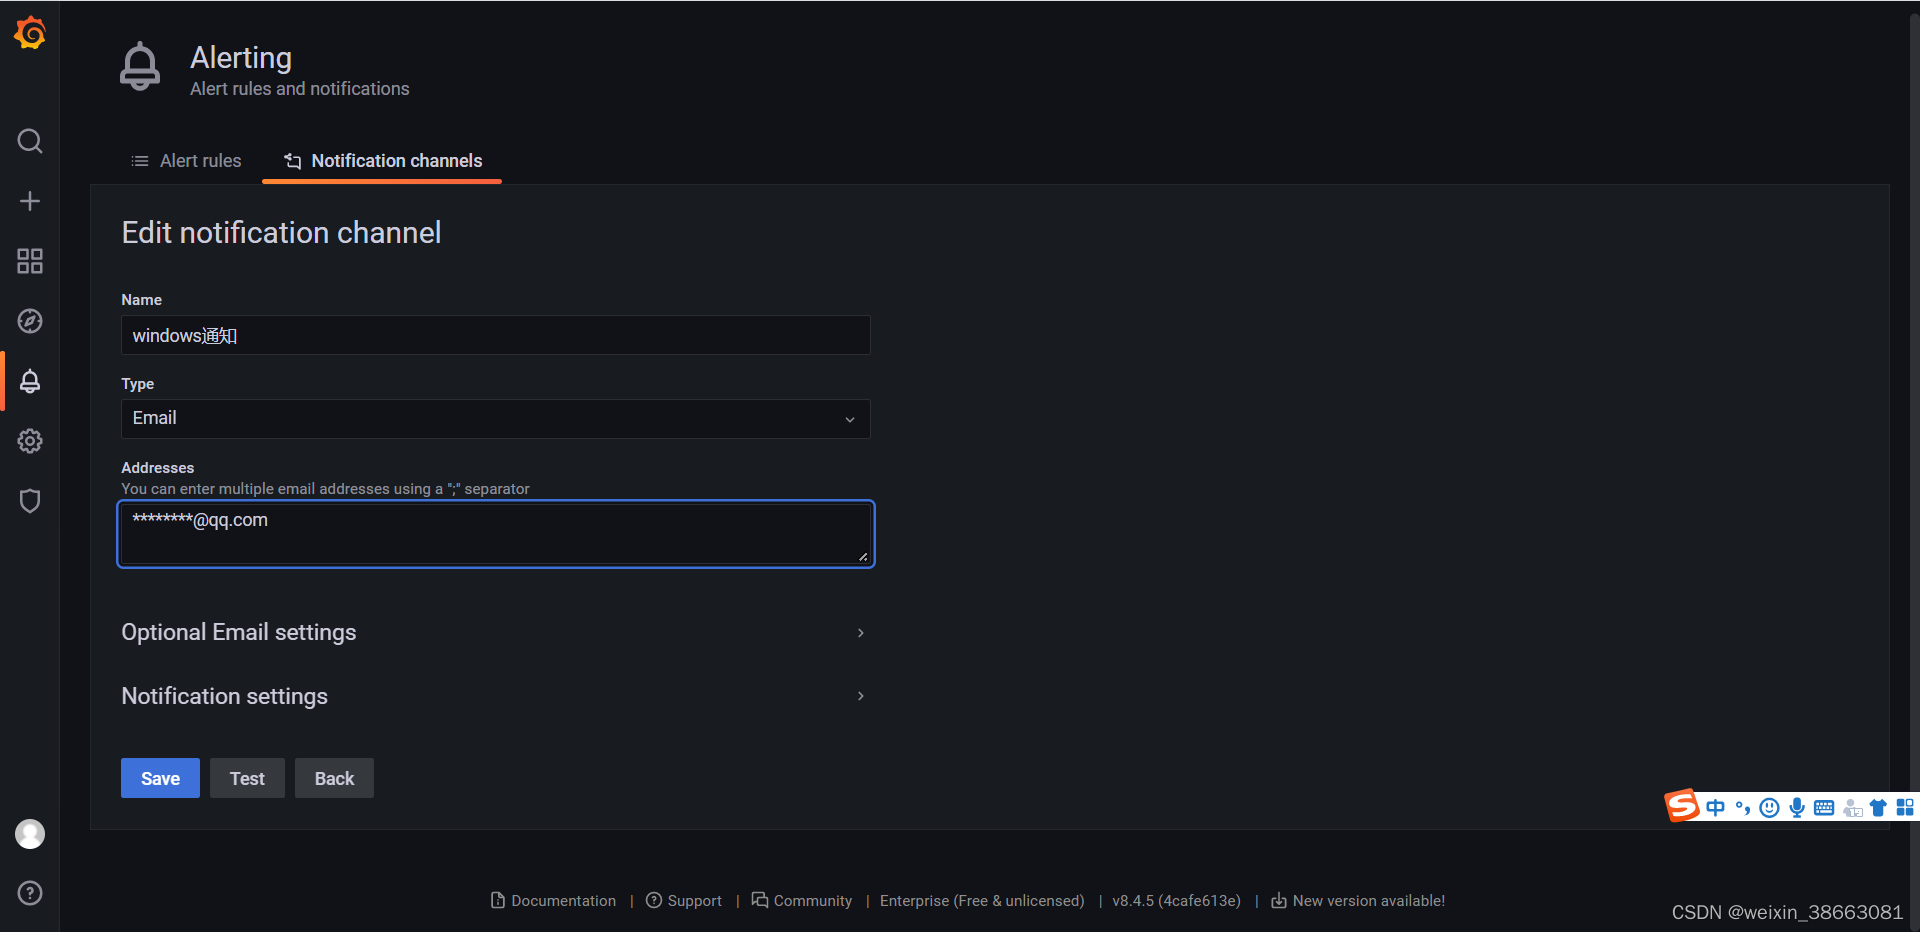
点击测试,如果出现错误看grafana的日志
五、注意事项
将grafana prometheus exporter的可执行文件以管理员的形式执行
参考资料
https://www.cnblogs.com/maohuidong/p/15831184.html
https://cloud.tencent.com/developer/article/1910016

北京人形旗下天工造物具身智能开源社区,聚焦具身天工与慧思开物两大平台
更多推荐
 1
1 0
0- 0


 已为社区贡献1条内容

所有评论(0)