【国科大数据科学导论】作业1:Linear regression with Yelp votes
·
前提
- 作者数据科学导论课程的大作业1
- 该博客源代码请点击此处—— Linear regression with Yelp votes
第二次作业请见文末
-
本文没有创新点,只是保存一下,想要了解更多的可以直接去kaggle看note
-
最后是本题的Bonus部分
-
Description of the data:
- yelp.json is the original format of the file. yelp.csv contains the same data, in a more convenient format. Both of the files are in this repo, so there is no need to download the data from the Kaggle website.
- Each observation in this dataset is a review of a particular business by a particular user.
- The “stars” column is the number of stars (1 through 5) assigned by the reviewer to the business. (Higher stars is better.) In other words, it is the rating of the business by the person who wrote the review.
- The “cool” column is the number of “cool” votes this review received from other Yelp users. All reviews start with 0 “cool” votes, and there is no limit to how many “cool” votes a review can receive. In other words, it is a rating of the review itself, not a rating of the business.
- The “useful” and “funny” columns are similar to the “cool” column.
流程
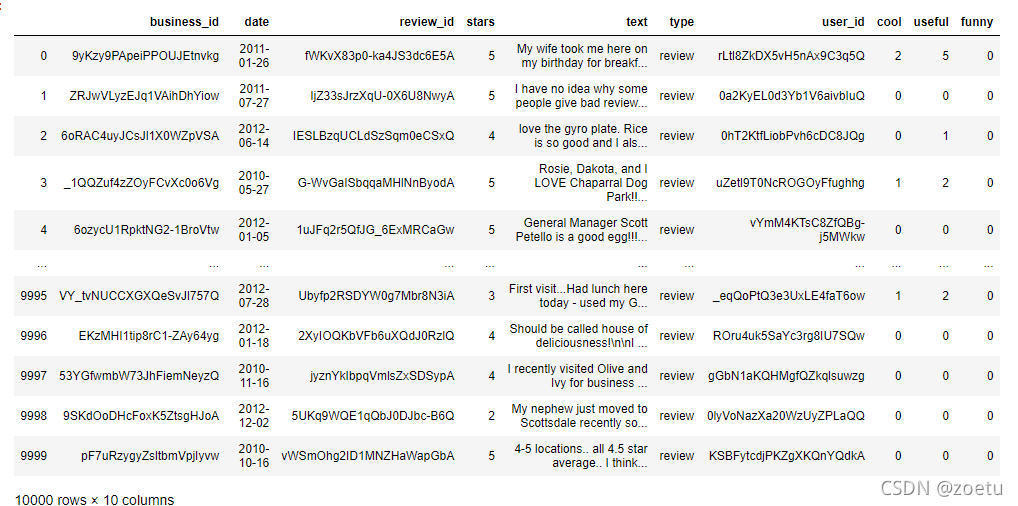
Task1—csv文件读为dataframe
- Read yelp.csvinto a DataFrame.
- 这一步就是将csv文件读成DataFrame方便后续处理数据
# access yelp.csv using a relative path
import pandas as pd
yelp = pd.read_csv('yelp.csv')
yelp
Task2—数据关系
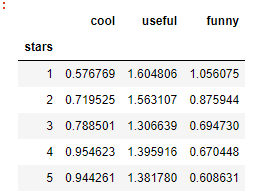
- Explore the relationship between each of the vote types (cool/useful/funny) and the number of stars.
- 这一步主要是观测数据之间的关系,默认是cool、userful以及funny会与stars有关。
- 将stars作为一个分类变量,通过比较cool/useful/funny各组的平均数来寻找差异。
#treat stars as a categorical variable and look for differences between groups by comparing the means of the groups
 yelp.groupby(['stars']).mean()
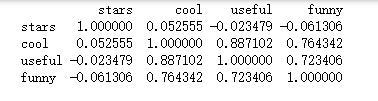
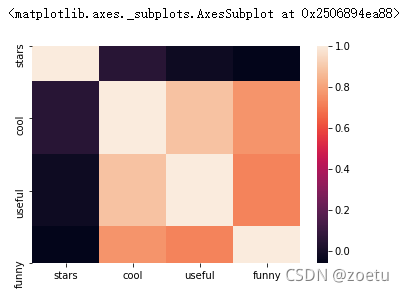
- 用热力图展示stars、cool、useful和funny两两变量的相似度
- 这里利用yelp.corr() 给出了任意两个变量之间的相关系数即相关系数矩阵
	#display acorrelation matrix of the vote types (cool/useful/funny) and stars
	%matplotlib inline
	import seaborn as sns
	print(yelp.corr())
	sns.heatmap(yelp.corr())
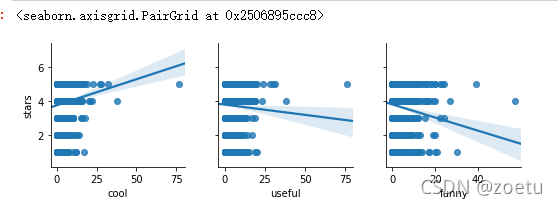
- stars和cool, useful, funny的线性回归
# display multiple scatter plots (cool, useful, funny) with linear regression line
import matplotlib.pyplot as plt
yelp.head(2)
sns.pairplot(yelp,x_vars=['cool','useful','funny'],y_vars='stars',kind='reg')
Task3—建立矩阵
- Define cool/useful/funny as the feature matrix X, and stars as the response vector y.
feature_cols = ['cool','useful','funny']
x = yelp[feature_cols]
y = yelp['stars']
Task4—拟合
- Fit a linear regression model and interpret the coefficients. Do the coefficients make intuitive sense to you? Explore the Yelp website to see if you detect similar trends.
from sklearn.linear_model import LinearRegression

linereg = LinearRegression()
linereg.fit(x,y)
print(linereg.coef_)

Task5—模型评估
- Evaluate the model by splitting it into training and testing sets and computing the RMSE. Does the RMSE make intuitive sense to you?
- 将模型分解为训练集和测试集
- 用RMSE(均方根误差)来评估模型
from sklearn.model_selection import train_test_split
from sklearn import metrics
import numpy as np
# define a function that accepts a list of features and returns testing RMSE
from sklearn.neighbors import KNeighborsClassifier

def test_RMSE(feature_cols):
    x = yelp[feature_cols]
    y = yelp['stars']

    #random_state=1 参数未变得到的随机数组是一样的
    train,test = train_test_split(yelp,random_state=1)
    x_train,x_test = train[feature_cols],test[feature_cols]
    y_train,y_test = train['stars'],test['stars']

    linereg = LinearRegression()
    linereg.fit(x_train,y_train)

    y_pred = linereg.predict(x_test)

    test_R = np.sqrt(metrics.mean_squared_error(y_test,y_pred))

    return test_R

# calculate RMSE with all three features
test_RMSE(['cool','useful','funny'])

Task6—误差与特征关系
- Try removing some of the features and see if the RMSE improves.
print(test_RMSE(['cool','funny']))
print(test_RMSE(['cool','useful']))
print(test_RMSE(['useful','funny']))
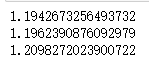
- 特征减小,误差变大了
Bonus
Task1(Bonus)—json文件处理
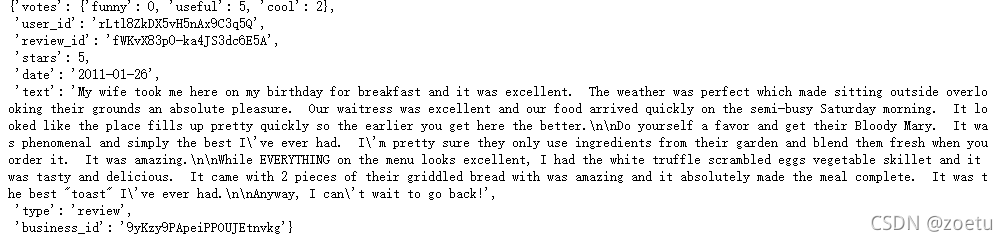
- Construct this DataFrame yourself from yelp.json.This involves reading the data into Python, decoding the JSON, converting it to a DataFrame, and adding individual columns for each of the vote types.
- 如何把json文件转换成datafram
# read the data from yelp.json into a list of rows
# each row is decoded into a dictionary named "data" using using json.loads()
import json
with open('yelp.json', 'r') as f:
    data = [json.loads(row) for row in f]

# show the first review
data[0]
# convert the list of dictionaries to a DataFrame
data = pd.DataFrame(data)
data.head(1)

# add DataFrame columns for cool, useful, and funny
data['cool']=''
data['useful']=''
data['funny']=''
# drop the votes column and then display the head
data = data.drop(['votes'],axis=1)
data.head(1)

Task 7 (Bonus)—添加特征
- Think of some new features you could create from the existing data that might be predictive of the response. Figure out how to create those features in Pandas, add them to your model, and see if the RMSE improves.
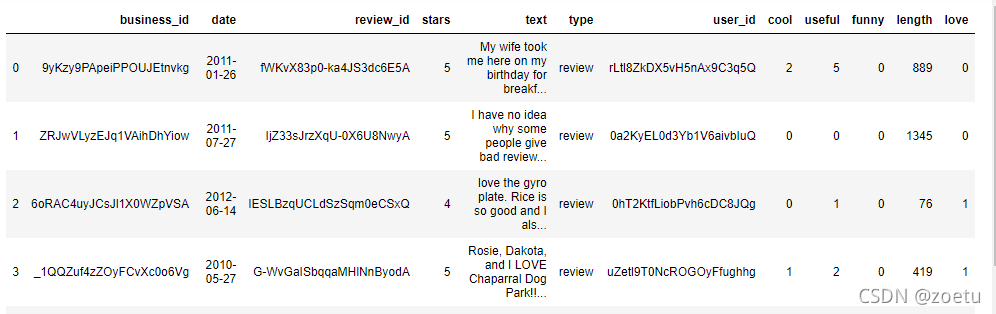
- 添加新特征
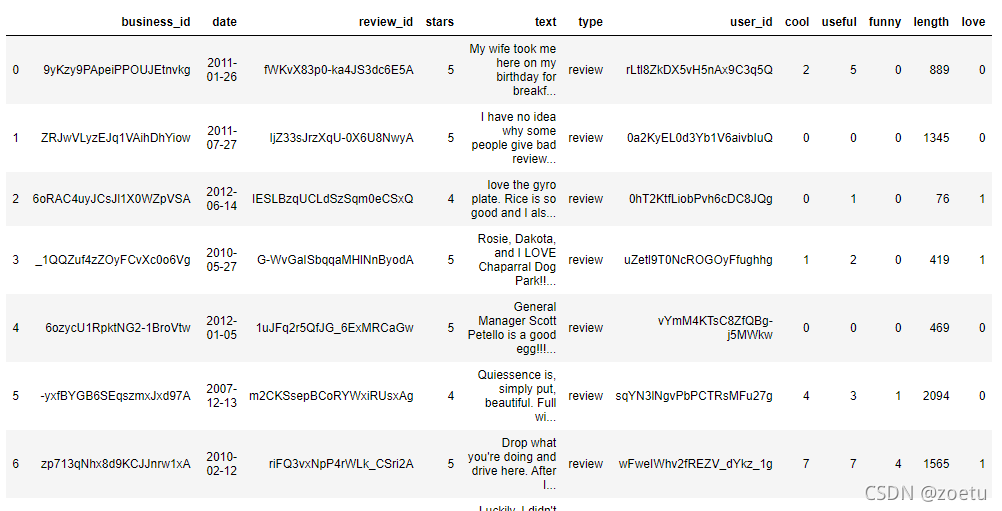
# new feature:评论长度
lens = yelp.text.apply(len)
yelp['length']= lens
yelp.head(10)
# new features: 评论中是否有喜爱
# pd.set_option( 'display.max_columns', None)#显示所有列
#显示所有行
# pd.set_option( 'display.max_rows', None)
# pd.set_option('max_colwidth',1000)#设置value的显示长度为100,默认为50

love = yelp.text.str.contains('love',case=False).astype(int)
yelp['love'] = love
yelp.head(5)
# add new features to the model and calculate RMSE
test_RMSE(['cool','useful','funny','length','love'])

- 添加两个特征之后,误差更小了
Task 8 (Bonus)—空模型误差
- Compare your best RMSE on the testing set with the RMSE for the “null model”, which is the model that ignores all features and simply predicts the mean response value in the testing set.
- 将误差最小的测试集和空模型的误差进行对比。
- 因为random_state=1,其他参数没有变化,所以得到的随机数组是一样的。
x_train, x_test, y_train, y_test = train_test_split(x, y, random_state=1)
y_null = np.zeros_like(y_test, dtype=float)
y_null.fill(y_test.mean())
y_null

import numpy as np
print(np.sqrt(metrics.mean_squared_error(y_test, y_null)))

- 计算均方误差回归损失
- 参考:https://blog.csdn.net/Dear_D/article/details/86136779
- 格式:sklearn.metrics.mean_squared_error(y_true, y_pred, sample_weight=None, multioutput=’uniform_average’)
- 参数:
- y_true:真实值。
- y_pred:预测值。
- sample_weight:样本权值。
- multioutput:多维输入输出,默认为’uniform_average’,计算所有元素的均方误差,返回为一个标量;也可选‘raw_values’,计算对应列的均方误差,返回一个与列数相等的一维数组。
小结
- 写这个作业的过程中遇到的问题大多数是函数调用参数问题,只能靠积累了。
- 需要进一步了解关于画图和回归以及误差的知识。
因为很多同学问我要参考,现上传了第二次作业。但是本人没有很细致的研究第二次作业,可能有误。仅供参考!!!!https://download.csdn.net/download/qq_43800119/87126390?spm=1001.2014.3001.5503

北京人形旗下天工造物具身智能开源社区,聚焦具身天工与慧思开物两大平台
更多推荐
 4
4 0
0- 0


 已为社区贡献1条内容

所有评论(0)